By: Catherine Clifford
View the original article here
George Rose | Getty Images News | Getty Images
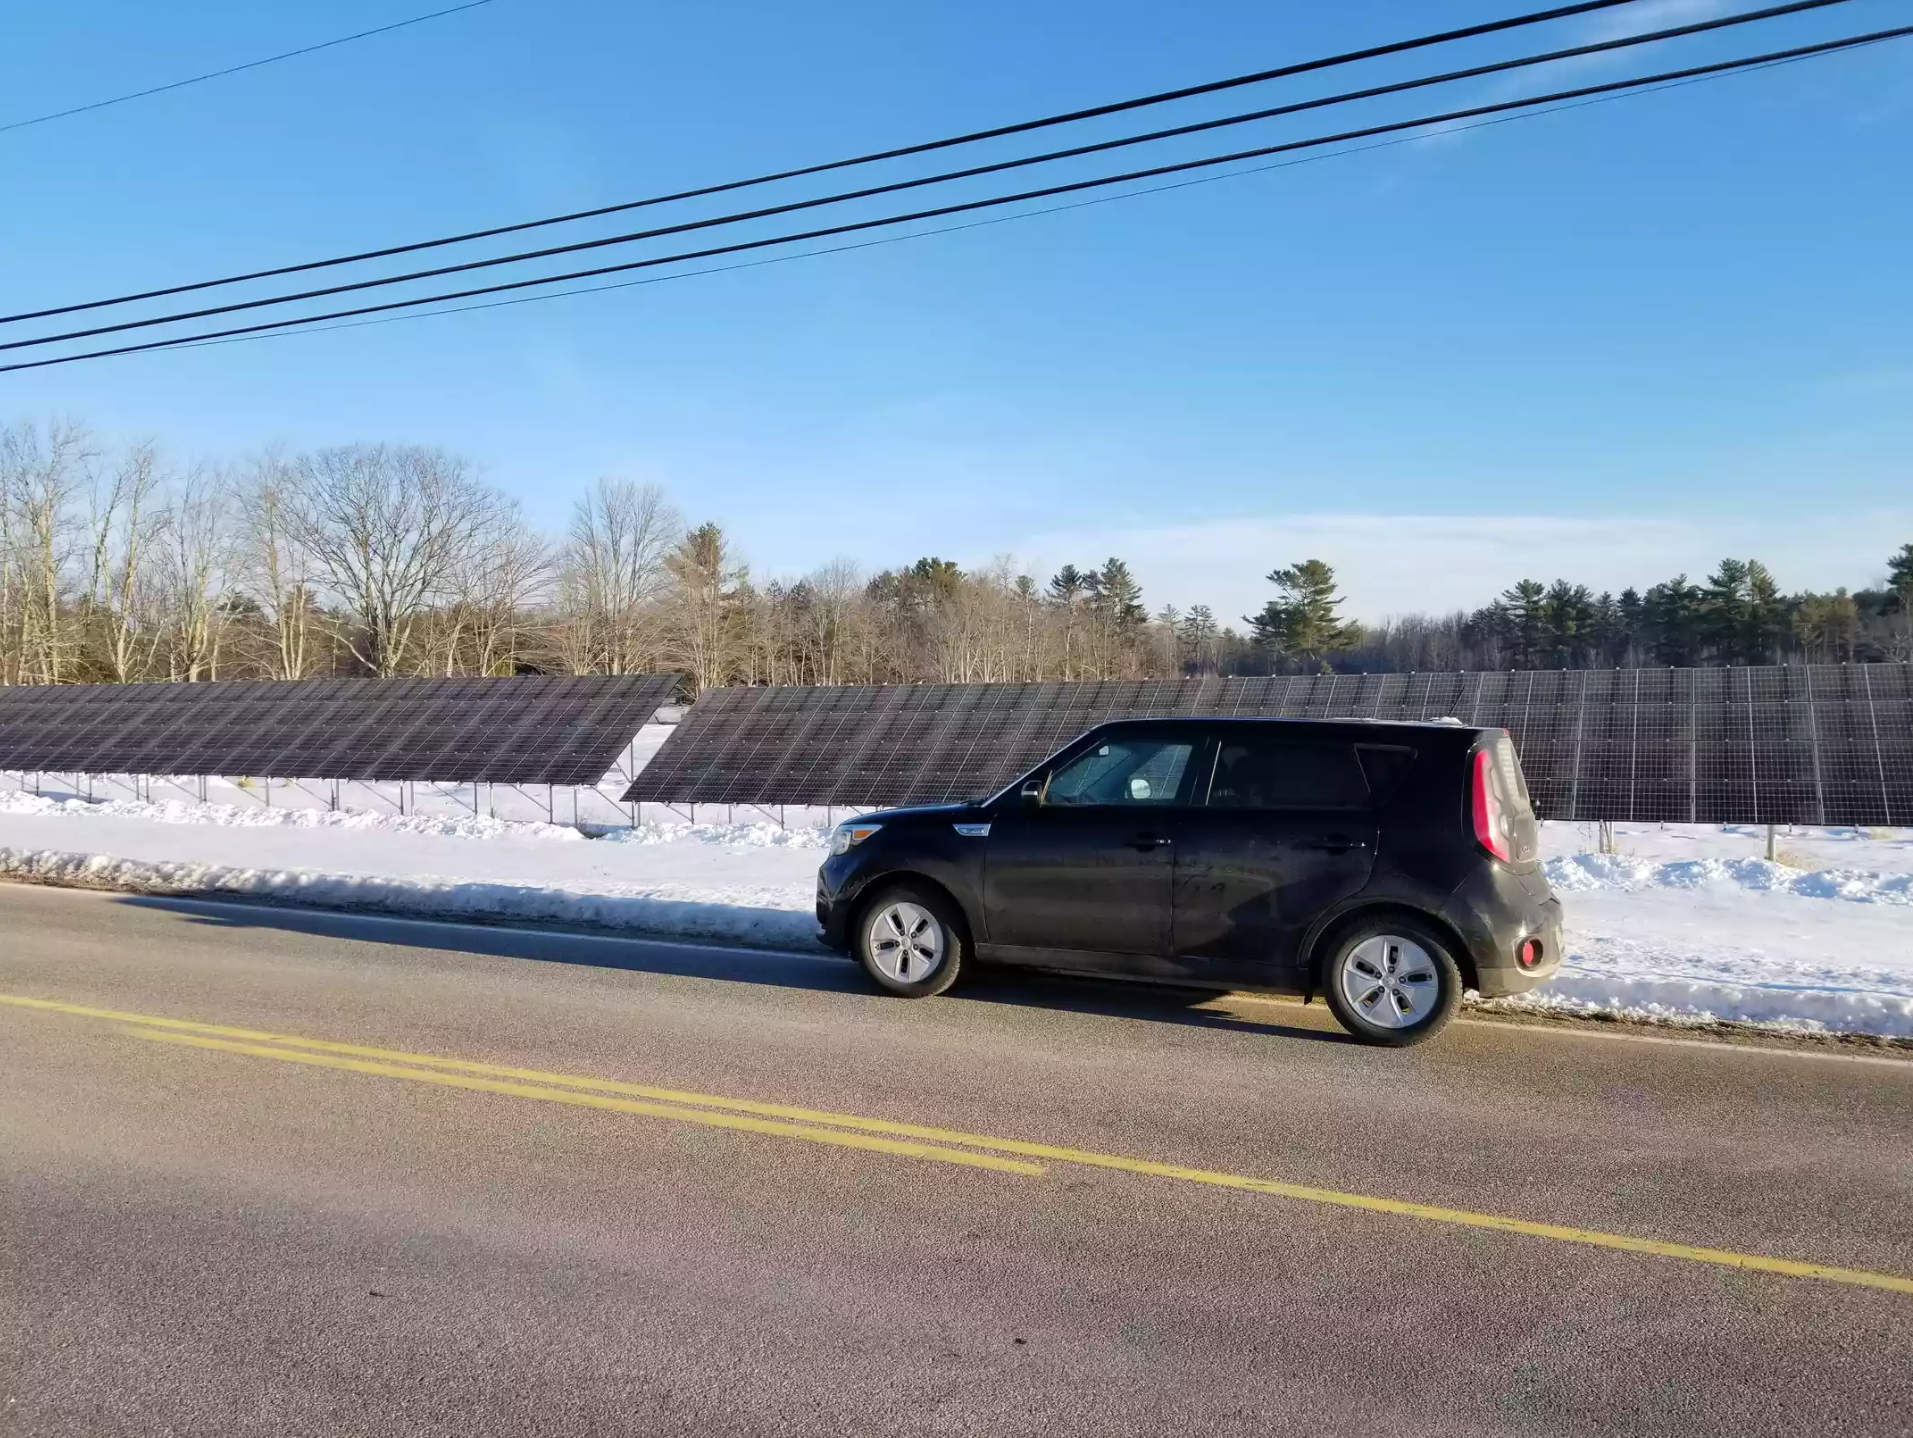
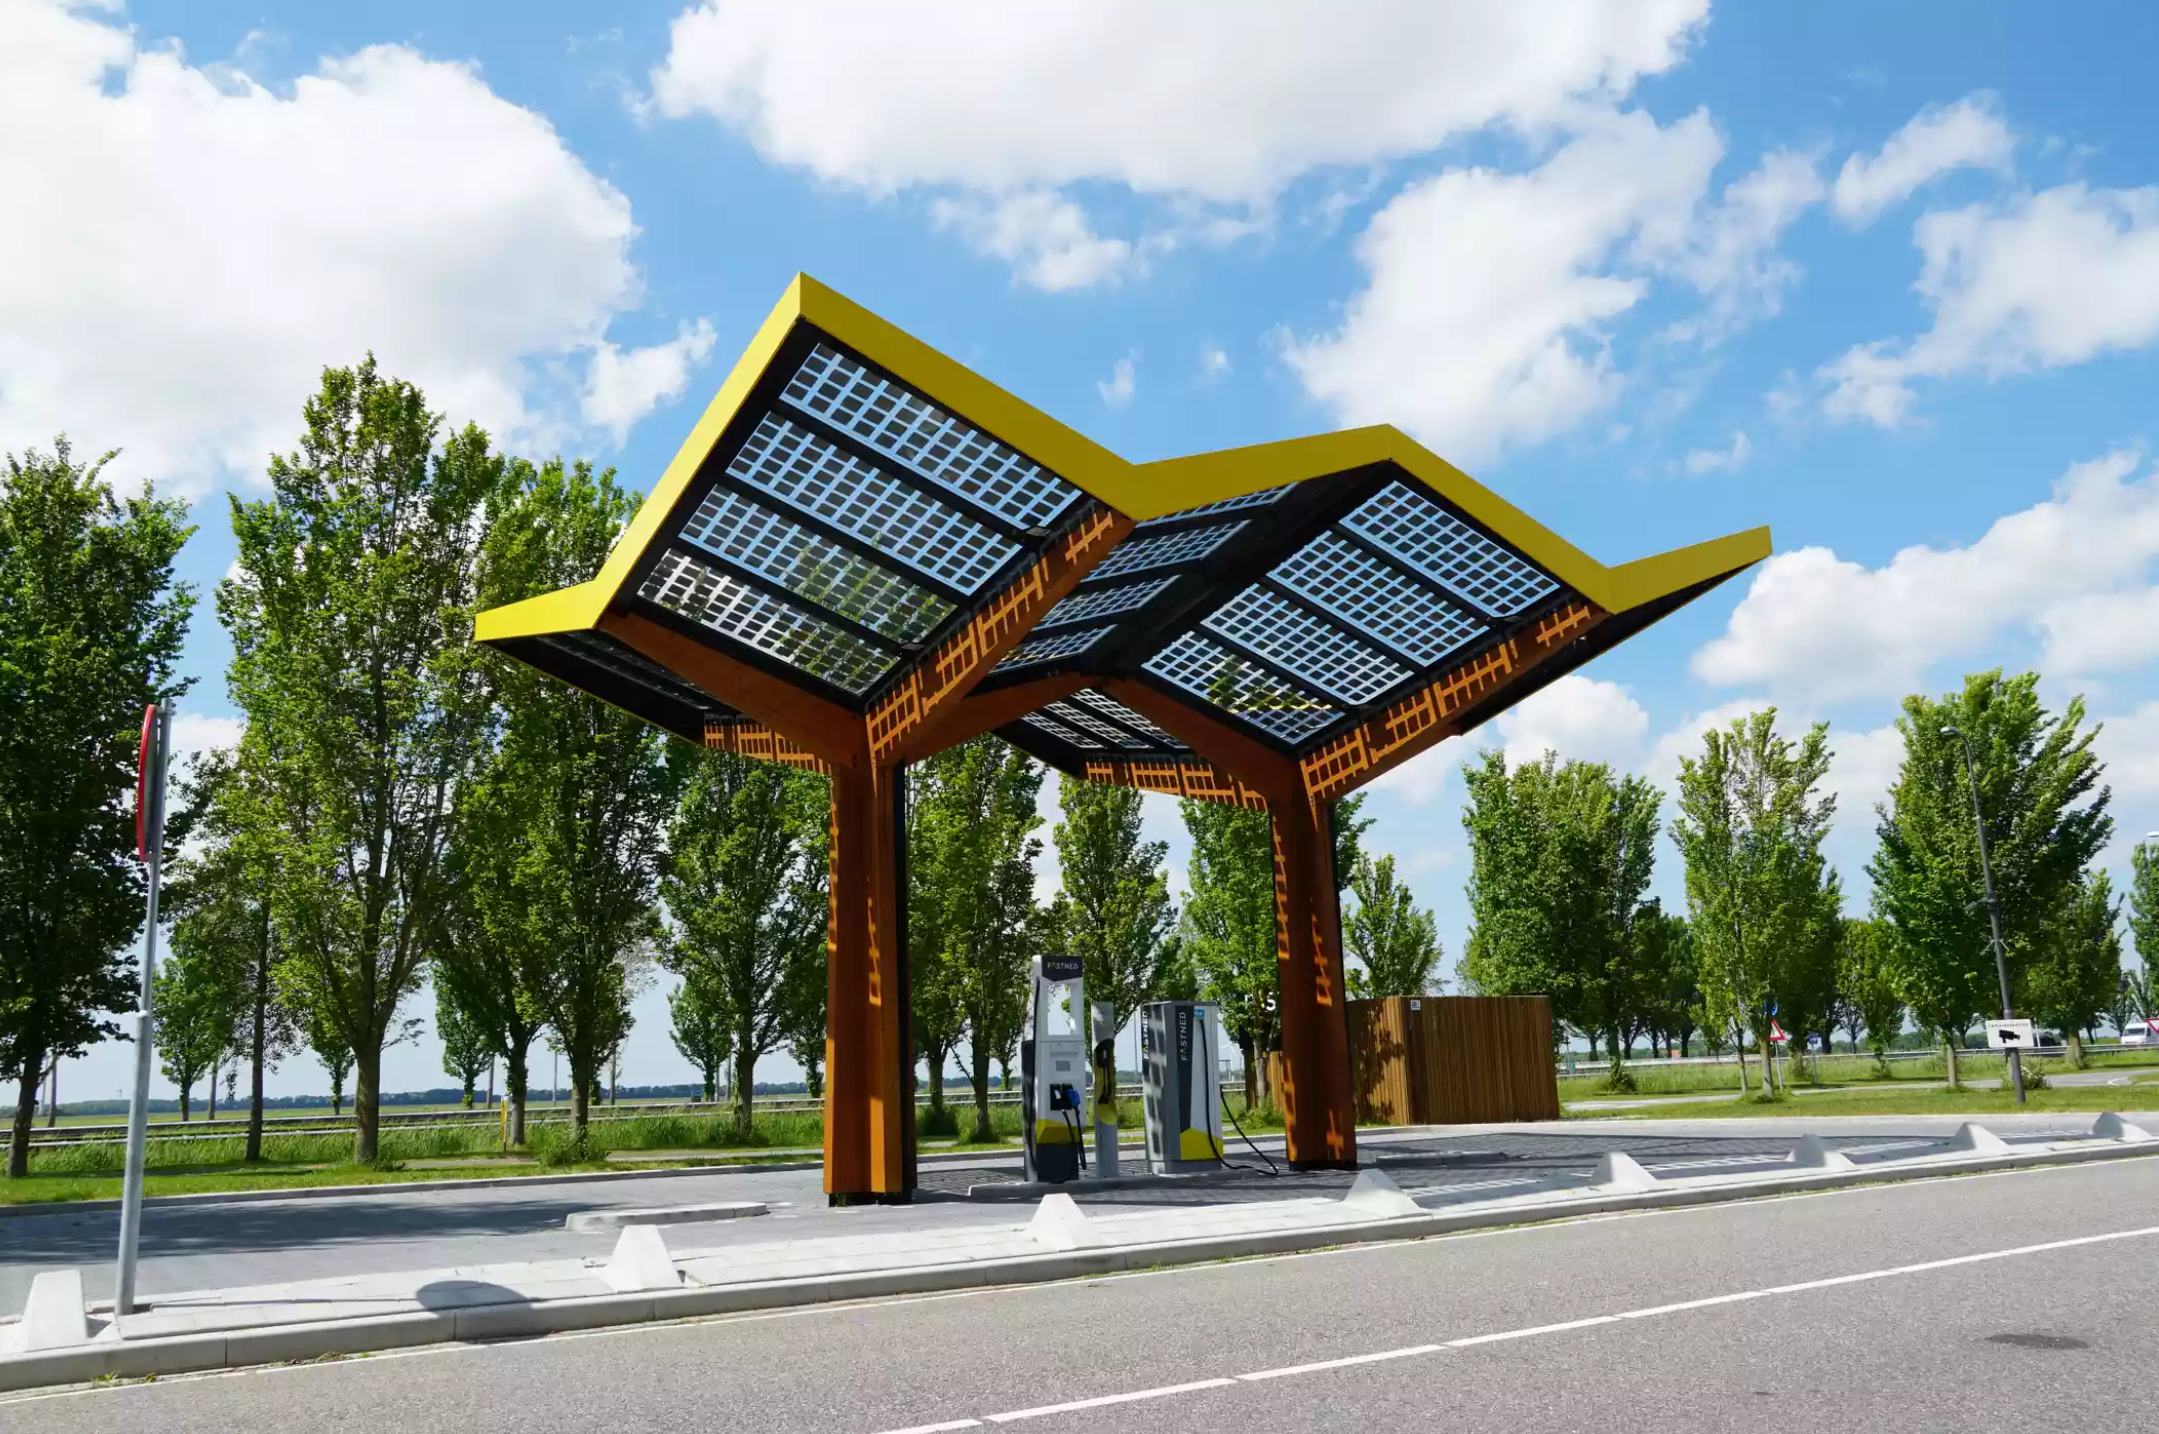
Wind and solar power generators wait in yearslong bureaucratic lines to connect to the power grid, only to be faced with fees they can’t afford, forcing them to scramble for more money or pull out of projects completely.
This application process, called the interconnection queue, is delaying the distribution of clean power and hampering the U.S. in reaching its climate goals.
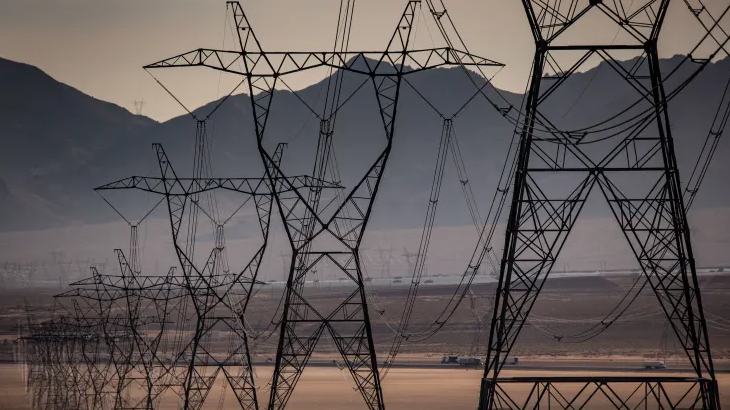
The interconnection queue backlog is a symptom of a larger climate problem for the United States: There are not enough transmission lines to support the transition from a fossil fuel-based electric system to a decarbonized energy grid.
Surprise fee increases
The Oceti Sakowin Power Authority, a nonprofit governmental entity owned by seven Sioux Indian tribes, is working to build 570 megawatts of wind power generation to sell to customers in South Dakota.
“Economic development through renewable energy speaks to the very heart of Lakota culture and values – being responsible stewards of Grandmother Earth, Unci Maka,” Jonathan E. Canis, general counsel for the Oceti Sakowin Power Authority, told CNBC. “Together our tribes occupy almost 20% of the land area of South Dakota. And the experts who have been measuring our wind resources literally describe them as ‘screamin.’.”
To connect wind power generation to the electric grid and make money from the sale of that power, the Oceti Sakowin Power Authority — like every electricity generator in the U.S. — has to submit an application called an interconnection request to whichever organization is overseeing the coordination of the electric grid in that region. Sometimes it’s a regional transmission planning authority, other times a utility.

Photo courtesy Oceti Sakowin Power Authority.
In late 2017, the Oceti Sakowin Power Authority paid a $2.5 million deposit to secure a place in line for its application to be reviewed by the Southwest Power Pool, a regional grid operator.
Five years later, in 2022, the Southwest Power Pool came back and told it that the fee to connect to the grid would actually be $48 million. That’s because connecting all that new power to the grid would require major updates to the transmission infrastructure.
The Oceti Sakowin Power Authority had 15 business days to come up with the extra $45.5 million.
“Needless to say, we couldn’t do it and had to drop out,” Canis told CNBC.
Now, the Oceti Sakowin Power Authority is reevaluating the size and composition of the project and plans to reenter the interconnection queue by the end of the year. That could mean another yearslong wait in line.
These burdens are typical.
In 2020, Pine Gate Renewables had a solar project located in the Piedmont region of North Carolina that it expected to cost $5 million to connect to the electric grid. The local utility in charge of overseeing the interconnection process told Pine Gate it would be more than $30 million. Pine Gate had to terminate the project because it couldn’t afford the new fees, its vice president of regulatory affairs, Brett White, told CNBC.
“We view, as a company, the interconnection problem as the biggest impediment to the industry right now and the costs associated with interconnection are the biggest reason that a project dies on the vine,” White said. “It’s the biggest wild card you have going into the project development cycle.”
There are efforts underway to improve the efficiency of the process, but they’re fundamentally putting a Band-Aid on top of an even deeper problem in the United States: There isn’t enough transmission infrastructure to support the energy transition from fossil fuel sources of energy to clean sources of energy.
“You could make the process for the queue as efficient and pristine as possible and it still could not be all that effective because at some point you’re going to run out of transmission headroom,” Wood Mackenzie analyst Ryan Sweezey told CNBC.
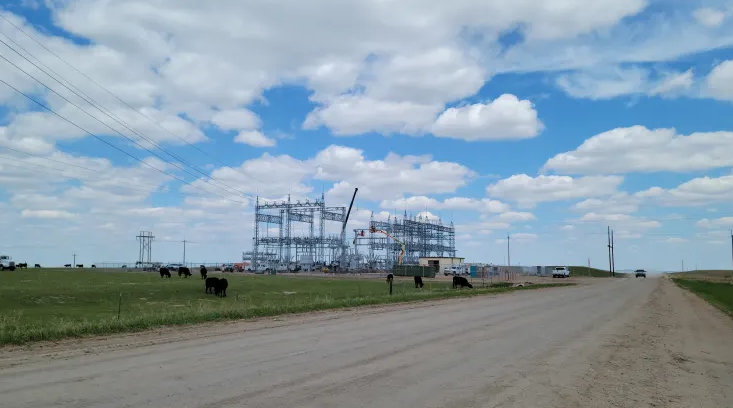
Photo courtesy Oceti Sakowin Power Authority.
Waiting in line
The entire electric grid in the U.S. has installed capacity of 1,250 gigawatts. There are currently 2,020 gigawatts of capacity in the interconnection queue lines around the country, according to a report published Thursday by the Lawrence Berkeley National Laboratory. That includes 1,350 gigawatts of power capacity, mostly clean, looking to be constructed and connected to the grid. The rest, 670 gigawatts, is for storage.
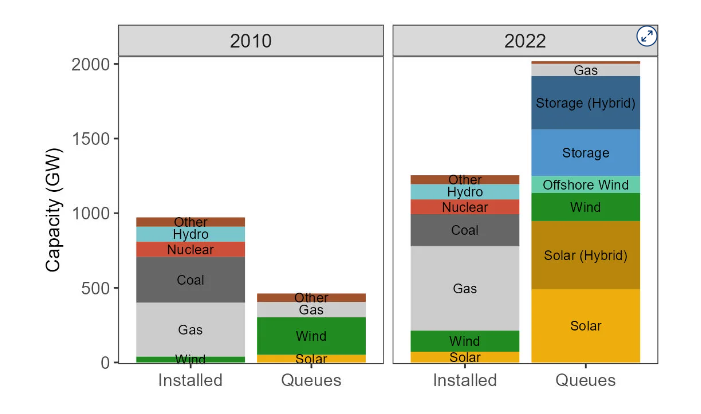
Chart courtesy Joseph Rand at Lawrence Berkeley National Laboratory.
Berkeley Lab pulls interconnection queue data from all of the regional planning territories in the United States and from between 35 and 40 utilities that are not covered by areas with regional planning authorities. The data covers between 85% and 90% of the electricity load in the United States, Joseph Rand, an energy policy researcher and the lead author of the study, told CNBC.
The interconnection process starts with a request to connect to the grid, which officially enters the power generator in the interconnection queue. The next step is a series of studies — the feasibility, system and facilities studies — where the grid operator determines what equipment or upgrades will be necessary to get the new power generation on the grid and what it will cost.
If all the parties can agree, then the power generator and grid operator reach an interconnection agreement, which establishes the grid improvements the power generator will pay for.
The total power capacity that comes out from a fossil fuel-burning power plant is often much greater than the capacity from renewable plants. That means it can take multiple wind or solar power generation plants — and, therefore, interconnection requests — to get the same units of energy online.
A single natural gas plant could be 1,200 megawatts, Sweezey told CNBC. “That’s one request — 1,200 megawatts,” Sweezey said. “Whereas usually if you’re going to get that same amount of capacity with renewables, that’s going to be six, seven, eight, nine, 10 different projects. So that’s 10 different requests in the queue.”
On average, it took a new power generation project 35 months to go from the interconnection request being filed with a grid operator to an interconnection agreement being reached in 2022, according to Berkeley Lab.
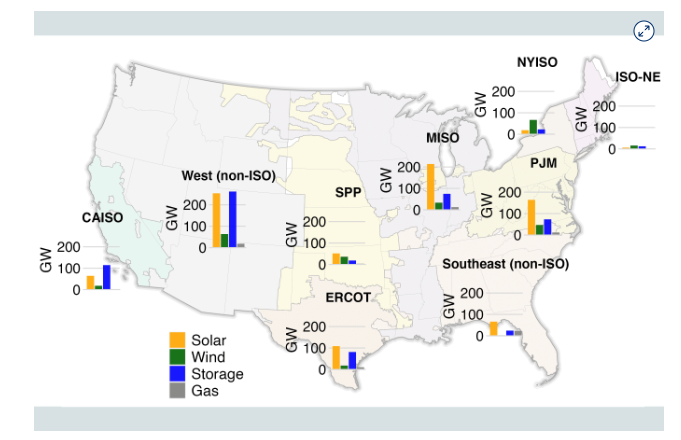
Chart courtesy Joseph Rand at Lawrence Berkeley National Laboratory.
How did this process become such a problem?
The U.S. energy grid is a patchwork system of many regional utility companies. Some provide transmission services and some don’t.
In an effort to promote competition, the Federal Energy Regulatory Commission issued an order in 1996 saying transmission service has to be provided to power generators on a nondiscriminatory basis. This allowed all kinds of power generators, including those that do not own transmission infrastructure, to compete. In 2003, it issued another order that standardized the interconnection process for energy generators.
Both orders “attempted to make the services one needs nondiscriminatory and fair to all users, for their respective service,” according to Rob Gramlich, founder of transmission market intelligence firm Grid Strategies.
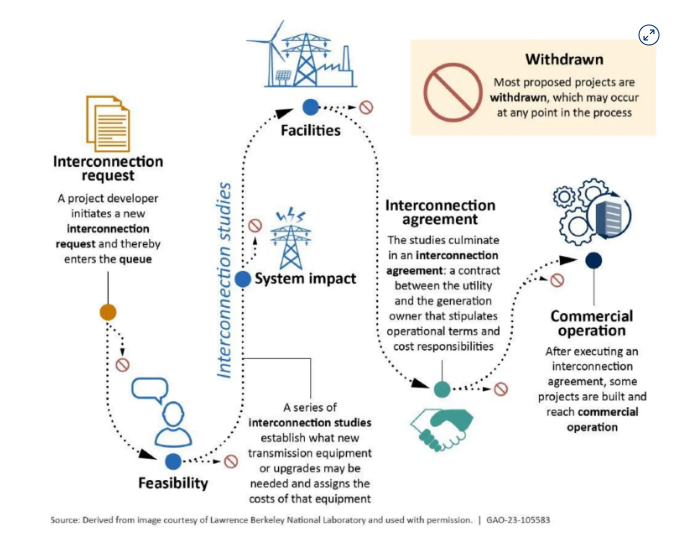
Chart courtesy the Government Accountability Office and Lawrence Berkeley National Laboratory.
That process worked well enough when the power generation industry was building large, centrally located energy plants that burned fossil fuels. But the process started to show signs of strain around 2008 when renewable energy started to come online in places where there was not sufficient transmission, Gramlich told CNBC. In April 2008, MISO, one of the regional operators, said it would take 42 years, until 2050, for it to get through its interconnection queue.
Reforms in 2008 and 2012 helped a little bit, Gramlich told CNBC. “But I think everybody’s realizing now that that original process is fundamentally unsuited to the new generation mix.”
The interconnection process is especially bad at estimating battery storage, said White. That’s because transmission planning is always defaulting to the worst-case scenario, but batteries will draw energy from the grid when the demand is low and energy prices are low, and then use that stored power when the grid is at or near capacity. Using worst-case-scenario planning for battery storage fundamentally misses the point of a battery.
“The upgrades that are going to be triggered on the system are going to be very, very extensive and very, very expensive. And so they hand you a bill that reflects that,” White told CNBC.
But that kind of system upgrade “in our mind is totally disassociated from the economics of the asset, and not really looking at the benefit that the project is going to provide to the system,” White said.
Texas makes it easier
The rates of interconnection applications that actually reach commercial completion vary significantly, but none are higher than 38% in the New England region, according to Berkeley Lab. The Texas grid operator, Electric Reliability Council of Texas, or ERCOT, has a completion rate of 31% and is the only other region with a completion rate of over 30%.
On the low end, the California Independent System Operator region has an 13% completion rate and the New York Independent System Operator region is at 15%.
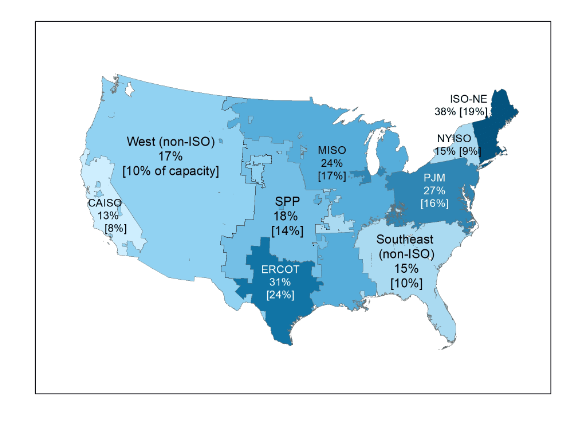
Chart courtesy Joseph Rand at Lawrence Berkeley National Laboratory.
The low percentage of interconnection requests that actually get built is partly because of the high cost to connect.
In the MISO region, for instance, interconnection costs were generally less than $100 per kilowatt-hour from 2008 to 2016, but have risen to a few hundred dollars per kWh for wind and solar, with spikes as high as $1,000 per kWh in some parts of the region, Gramlich told CNBC.
Adding even small amounts of energy to the grid requires infrastructure improvements because it’s nearly at capacity. Pushing those costs onto the builders of individual renewable projects generally makes them economically unsustainable.
“Those projects ended up withdrawing from the queue or terminating, because they don’t pencil anymore,” White told CNBC.
Some of the completion rates are artificially low because developers don’t actually expect to complete them all, but instead shop the same project around to various regional grid operators to get the best deal — what’s called “speculative queuing,” Sweezey told CNBC. It’s not expensive to get into queues, so developers submit applications to get information about which location will require the least expensive upgrades.
For grid operators, having power generators stuff their queues is overwhelming an already taxed system.
“Projects that have come through the process are not being built and becoming operational,” Jeffrey Shields, a PJM Interconnection spokesperson, told CNBC. “There are about 38,000 MW of renewable projects that have no further PJM requirements but are not being built because of siting, supply chain, or other issues facing the industry that are not related to PJM’s interconnection process.”
The long application timelines and expensive upgrades have made Texas a desirable place to build renewable energy projects because the state has its own interconnection application process.
“There is Texas, and then there’s the rest of the country with respects to interconnection,” White of Pine Gate told CNBC. Texas doesn’t require the same level of network upgrades to get power generation connected to the grid so getting a project online in Texas is faster and lower cost than the rest of the country, White said.
“You can put a project in the PJM queue tomorrow and it may not get constructed and built until 2030, whereas if you do the same with the Texas project, right now, it’s probably online in two to three years. So it’s just a much, much shorter timeline to commercial operation for a project in Texas,” White told CNBC.
But Texas also has a unique risk because ERCOT can decide to limit the amount of power that a generator can sell to the market if a particular electric corridor gets overly congested.
“It’s a bit of a double-edged sword,” White told CNBC. But with infrastructure deals, “time kills deals, time kills projects,” White said, so energy developers may prefer to take the risk and get the deal done.
Anadolu Agency | Anadolu Agency | Getty Images
How does this situation get fixed?
In June 2022, FERC issued a proposal on interconnection reforms to address queue backlogs and has since received a slew of public comments.
“We understand that 80 to 85 percent of the projects that are waiting in the queue ultimately are not being built. I think FERC has an opportunity here to make sure that we unlock that bottleneck and that we do all that we can to move those projects forward,” FERC Chairman Willie Phillips said on March 16, according to a statement provided by a FERC spokesperson.
The proposed rule change would offer incremental improvements, like providing information to developers so they can make more informed siting decisions without flooding the queue with speculative requests, and imposing more strict mandates on the regional grid operators to complete studies in a given time period, Rand of Berkeley Lab told CNBC.
“I do think what FERC is proposing has the potential to improve this situation,” Rand told CNBC. But fundamentally, these iterative changes won’t be a silver bullet.
“The energy transition is here. But our updating and expansion of our electric transmission system so far has not even remotely kept pace with that velocity, rate of change we are seeing on the generator-supply side,” said Rand.
There’s also a shortage of the kinds of electrical and transmission engineers required to process all of these applications, Sweezey and White told CNBC. “There’s just not enough people and so we have to think about what is the smartest way to maximize that expertise. And that means getting those engineers out of some of the rote manual data entry and into the actual analysis,” White told CNBC.
Another option is building new sources of clean energy that can be constructed closer to where demand is needed, like small nuclear reactors, Sweezey told CNBC. “I just don’t think people have come to that realization yet.”
Building sufficient transmission to support the energy transition is not necessarily a technical challenge as much as it is a political one.
“The type of coordination and planning that’s required for this kind of large-scale transmission — this involves maybe multiple utilities, multiple grid operators, multiple states, cities, counties, everything, even the feds are all involved — and that is antithetical to the U.S. as structured as a decentralized nation,” Sweezey told CNBC.
But the stakes are high.
“Even with all of the work, with all this great stuff that’s in the IRA and all of the wind that is in the sails of decarbonization in the renewable industry, if you can’t address transmission and infrastructure, then those goals aren’t going to be met,” White told CNBC.
“It really is the bottleneck that’s preventing that from happening.”