Contributed by Dr. Brennan Gantner, CEO and co-founder of Skip Technology
View the original article here
This article is part one of a two-part series addressing energy curtailment. Part two will be published later this week on Renewable Energy World.
New reports detailing the staggering waste of two-thirds of the energy generated in the USA have society scrambling to understand how. While electricity generation and transmission loss are hardly new, the rise of renewable energy (RE) sources has led to a staggering amount of energy that is literally thrown away- rendered unusable.
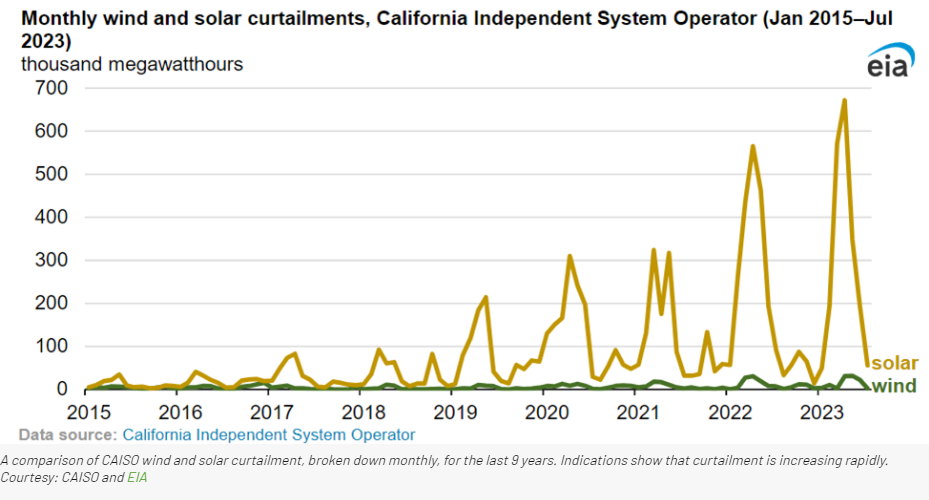
In 2022, the California Independent System Operator (CAISO) curtailed 2.4 million megawatt hours (MWh) of utility-scale wind and solar output, a 63% increase from the amount of electricity curtailed in 2021, per the U.S. Energy Information Administration (EIA). At wholesale costs, that’s millions of dollars of economic loss; At the current average end-user rate for electricity in California of $0.33/kWh, it’s $800 billion dollars lost.
Storage and timed release of electricity through the use of large-scale energy storage systems could cure the curtailment problem, reducing wasted clean power and potentially saving billions of dollars.
What is energy curtailment?
Large-scale energy use via the electrical grid is a finely balanced process. For decades, the state of California has suffered from rolling brownouts due to insufficient generation. Texas has seen similar problems from wholly different causes, with electricity generation failing at low temperatures, resulting in mass blackouts and more. And while underproducing energy, especially drastically compared to demand, is a life-threatening issue, overproducing energy can negatively impact the stability and longevity of the grid. Sufficient excess can cause everyday power surges but on much larger scales. This damages or destroys anything grid-tied: appliances, manufacturing, transformers, or minor electronics like phones and chargers. Even when equipment is not damaged, sufficient supply-demand imbalance, where supply outstrips demand, results in power being reflected back to the grid, to be lost as heat.
To walk the narrow line between under and over-production, US utilities use a bulk production method for primary generation supplemented by variable output and smaller fast spin-up plants to meet demand that varies by time-of-use (TOU). Historically, US bulk generation has been provided by coal. Coal plants have longer ramp-up and cooldown times, which makes them ideal for steady, bulk generation, while natural gas peaker plants have been used for on-demand generation during high TOU.
Coal has proven problematic in many ways. With massive carbon and sulfide output, coal plants generate potent greenhouse gasses and radioactive dust. More extreme weather effects due to climate change are being observed, thanks, in large part, to years of coal power plant output. Worse, coal pollution at every stage, from mining to burning, produces multiple adverse health conditions. From miners with lung disease to local residents receiving VERY large radiation doses, the economic costs of coal are staggering, let alone the humanitarian ones. Burning natural gas (methane with trace additives) is cleaner but still results in greenhouse gases. What’s needed are electricity production methods that don’t release CO2. Enter renewable energy (RE),
RE comes from natural processes that can be tapped without burning anything. The current market winner is solar energy, with wind and water trailing. Natural processes, however, occur sporadically, at times that often are not the same schedule as when society would like to use power. Solar, for example, is only available during the day. Turbines only produce power when the wind blows. Hydroelectricity from water can be more stable until a drought occurs, such as has been the case with Lake Mead, resulting in widespread power outages. Each RE source has drawbacks, but all share the same benefit: they don’t produce greenhouse gasses and perpetuate further climate change.
Why does curtailment happen?
Because the grid requires balancing supply and demand, every US grid runs a surplus whose size is determined by how well providers can forecast demand. Good forecasts result in small but real waste. Bad forecasts, however, result in either blackouts or massive waste. This excess power is the first type of curtailment, where power is supplied beyond the demand. Mitigating this at the grid scale is a complex process, often involving multiple agencies that are slow to act.
RE does not make curtailment any less of a problem. If anything, inherent RE variability exacerbates the complexity of matching supply to demand: solar peaks midday, wind peaks whenever the wind blows, but usage peaks when the workday ends, as workers return home, cook dinner, watch TV, and are generally awake after the sun sets. This typically results in TOU rate hikes. Usage also spikes in the late afternoon in locations that require cooling, like much of the southern US. On particularly warm days, when air conditioning is a life-saving necessity, the heat curve lags behind the illumination curve, so while the peak of solar energy production is midday, the heat peak is between 3 and 5 pm. Finally, usage peaks at night in locations that require heating. In particular, transitioning from local fossil fuel-burning heat sources in the northern part of the country to heat pumps, results in usage for heating peaking overnight into early morning.
Additionally, large amounts of California Independent System Operator (CAISO) curtailment are reported seasonally. Solar production ramps up through spring to peak in summer, but usage lags production. The seasonal variation in RE results in not a mismatch of hours, but potentially months.
A general solution is the same as for fossil fuels: produce exactly as much as needed for the worst-case scenario- that way, there’s always power. On average, a large excess of power is generated. This is the second form of curtailment, where (dirty) power is produced concurrent with RE production, and excess energy is discarded. This is how energy production in the US currently works because it is currently more cost-effective (in multiple ways) for excess energy to be curtailed instead of stored to average out over high-demand periods. Consider, for example, the case where external government subsidy makes wind and solar construction, functionally, free. Then, because storage would cost money, it’s cheaper to simply build sufficient wind and solar to always have power, curtailing what’s not needed.

Another type of curtailment occurs due to transmission infrastructure limitations. Transcontinental transmission wires can only transmit so much power. When too much is generated it’s often curtailed to prevent overloading transmission wires, which at sufficient power can melt them. The safety limits are set low and do not account for changing conditions. With proper monitoring, more energy could be transmitted on the same set of lines by taking conditions into account. Heimdall Power has launched a device that sits on transmission lines and feeds real-time information about conditions to centralized monitoring. Set to be tested in the US in 2025, it could allow 40% more power to be transmitted using existing wires.
What are the costs of curtailment?
While subsidies exist, it is not functionally free to construct RE generation. Curtailment happens in large part for economic reasons, though the cost is more complex than the materials and installation costs of storage methods. As cited in the introduction of this article, in 2022 the CAISO curtailed 2.4 million megawatt hours (MWh) of utility-scale wind and solar output, a 63% increase compared to electricity curtailed in 2021. At the average end-user rate for electricity in California of $0.33/kWh, that’s $800 billion dollars in loss.
Those costs aren’t necessarily economically real, but it’s a place to start. Assuming greater availability did not impact price, they can be compared to the costs to generate the wasted excess. In 2022, the average utility-scale solar installation cost per watt was $1.07, rising to $1.16 in the first quarter of 2023. Using these figures, the extra generation installation cost is:


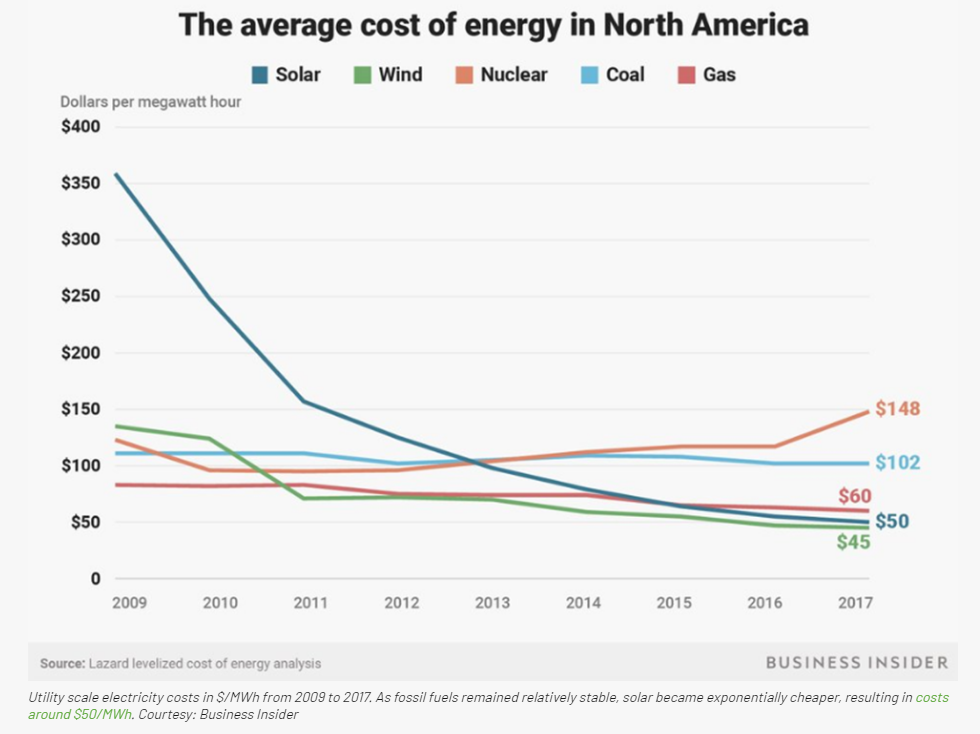
These costs are decreasing, but the decrease is leveling off, with current wholesale costs as low as $30/MWh. The construction represents just the sunk costs in building additional generation, while the wholesale electricity rate represents what a market with an infinitely large demand for electricity absorbs if available. While neither of those is the case, the true economic value lost must be somewhere between.
New advances decrease these costs. Solar was not competitively priced until 15 years ago, and today solar electricity is among the cheapest available. It may ultimately be cheaper to overbuild energy production facilities should those costs prove cheaper than storage costs. Indeed, with the cost of Lithium-ion (li-ion) batteries approaching $100/kWh, it makes sense to consider alternative approaches to li-ion on cost.
