Financial Benefits

Utilities are starting to invest in big batteries instead of building new power plants

By Jeremiah Johnson and Joseph F. Decarolis
View the original article here.

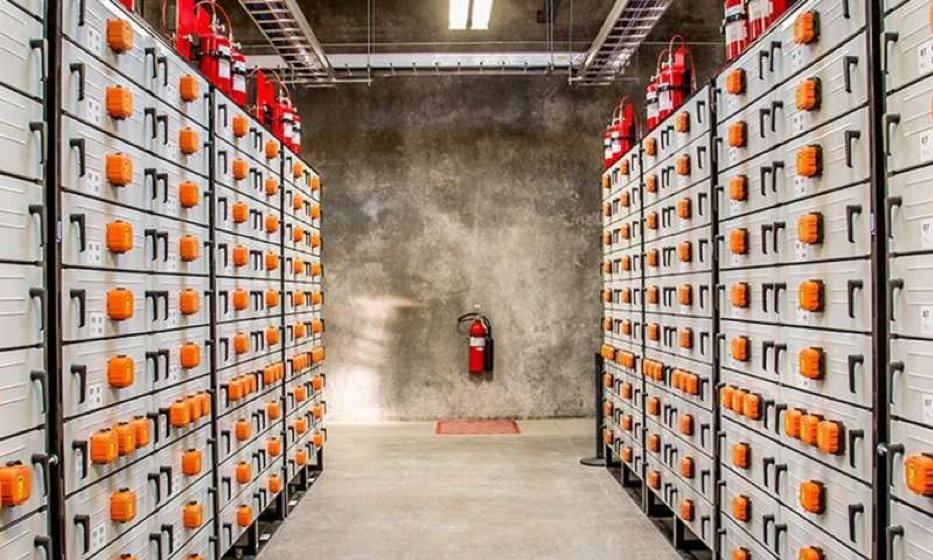
This is what a 5-megawatt, lithium-ion energy storage system looks like. Credit: Pacific Northwest National Laboratory

This is what a 5-megawatt, lithium-ion energy storage system looks like. Credit: Pacific Northwest National Laboratory

Due to their decreasing costs, lithium-ion batteries now dominate a range of applications including electric vehicles, computers and consumer electronics.

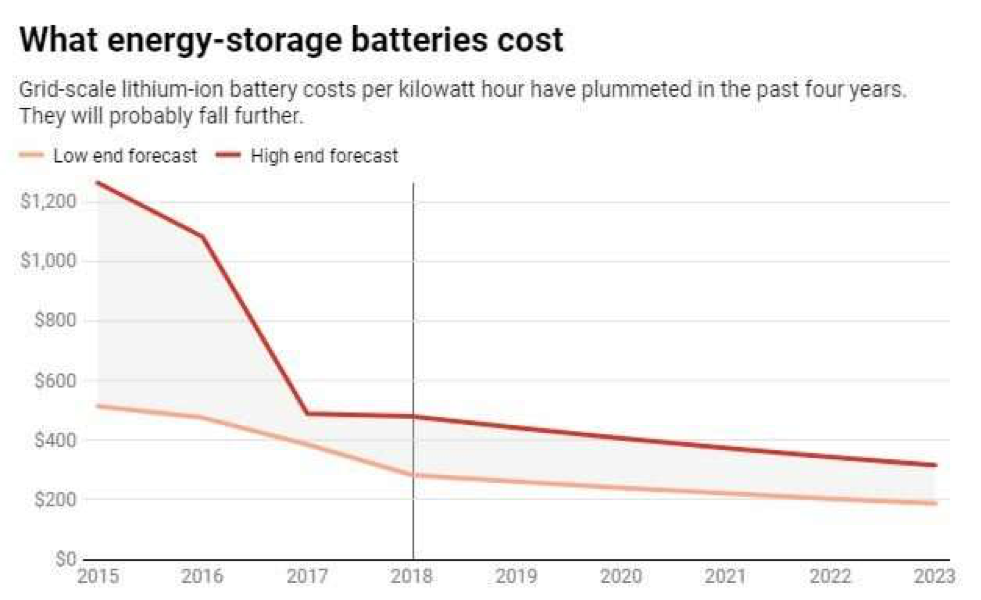
You might only think about energy storagewhen your laptop or cellphone are running out of juice, but utilities can plug bigger versions into the electric grid. And thanks to rapidly declining lithium-ion battery prices, using energy storage to stretch electricity generation capacity.

Based on our research on energy storage costs and performance in North Carolina, and our analysis of the potential role energy storage could play within the coming years, we believe that utilities should prepare for the advent of cheap grid-scale batteries and develop flexible, long-term plans that will save consumers money.

Peak demand is pricey

The amount of electricity consumers use varies according to the time of day and between weekdays and weekends, as well as seasonally and annually as everyone goes about their business.

Those variations can be huge.

For example, the times when consumers use the most electricity in many regions is nearly double the average amount of power they typically consume. Utilities often meet peak demand by building power plants that run on natural gas, due to their lower construction costs and ability to operate when they are needed.

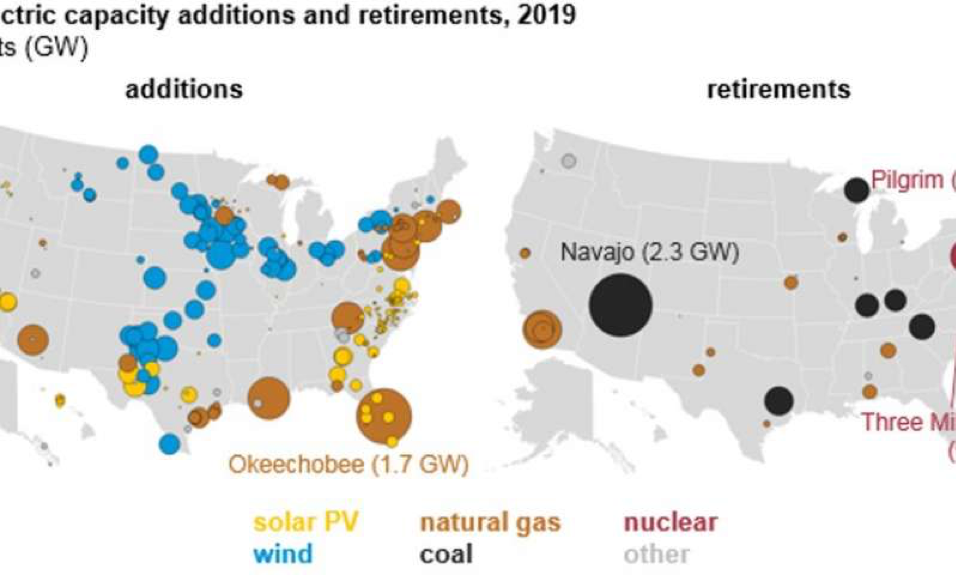
All of the new utility-scale electricity capacity coming online in the U.S. in 2019 will be generated through natural gas, wind and solar power as coal, nuclear and some gas plants close. Credit: U.S. Energy Information Administration

All of the new utility-scale electricity capacity coming online in the U.S. in 2019 will be generated through natural gas, wind and solar power as coal, nuclear and some gas plants close. Credit: U.S. Energy Information Administration

However, it’s expensive and inefficient to build these power plants just to meet demand in those peak hours. It’s like purchasing a large van that you will only use for the three days a year when your brother and his three kids visit.

The grid requires power supplied right when it is needed, and usage varies considerably throughout the day. When grid-connected batteries help supply enough electricity to meet demand, utilities don’t have to build as many power plants and transmission lines.

Given how long this infrastructure lasts and how rapidly battery costs are dropping, utilities now face new long-term planning challenges.

Cheaper batteries

About half of the new generation capacity built in the U.S. annually since 2014 has come from solar, wind or other renewable sources. Natural gas plants make up the much of the rest but in the future, that industry may need to compete with energy storage for market share.

In practice, we can see how the pace of natural gas-fired power plant construction might slow down in response to this new alternative.

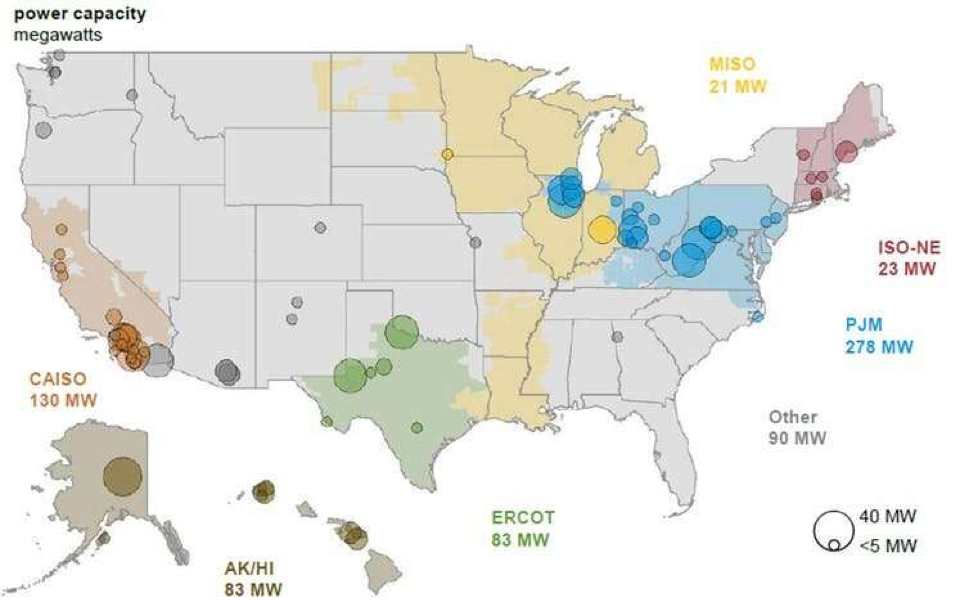
Grid-scale batteries are being installed coast-to-coast as this snapshot from 2017 indicates. Credit: U.S. Energy Information Administration, U.S. Battery Storage Market Trends, 2018.

Grid-scale batteries are being installed coast-to-coast as this snapshot from 2017 indicates. Credit: U.S. Energy Information Administration, U.S. Battery Storage Market Trends, 2018.

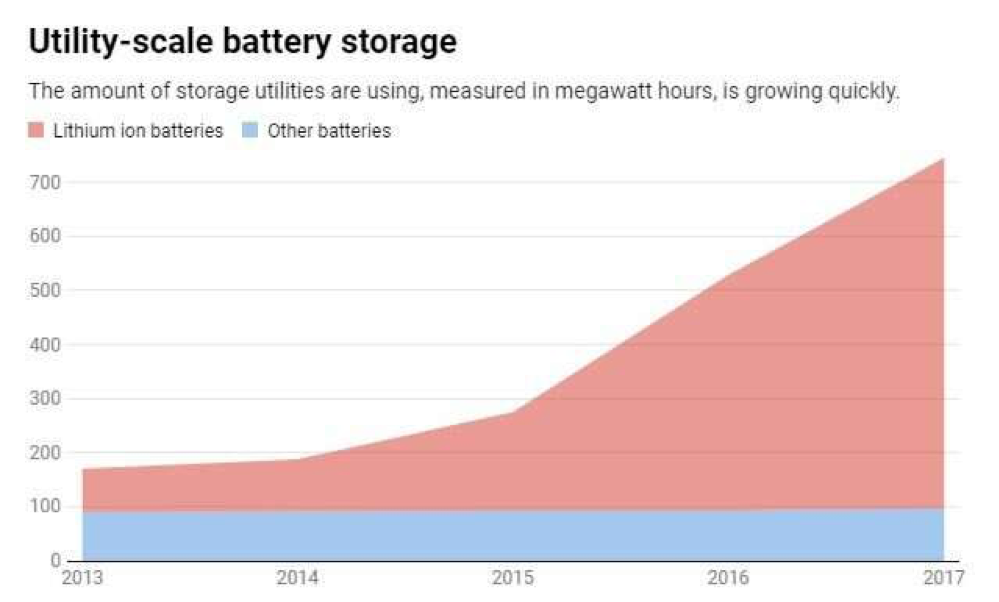
So far, utilities have only installed the equivalent of one or two traditional power plants in grid-scale lithium-ion battery projects, all since 2015. But across California, Texas, the Midwest and New England, these devices are benefiting the overall grid by improving operations and bridging gaps when consumers need more power than usual.

Based on our own experience tracking lithium-ion battery costs, we see the potential for these batteries to be deployed at a far larger scale and disrupt the energy business.

When we were given approximately one year to conduct a study on the benefits and costs of energy storage in North Carolina, keeping up with the pace of technological advances and increasing affordability was a struggle.

Projected battery costs changed so significantly from the beginning to the end of our project that we found ourselves rushing at the end to update our analysis.

Once utilities can easily take advantage of these huge batteries, they will not need as much new power-generation capacity to meet peak demand.

Credit: The Conversation

Credit: The Conversation

Utility planning

Even before batteries could be used for large-scale energy storage, it was hard for utilities to make long-term plans due to uncertainty about what to expect in the future.

For example, most energy experts did not anticipate the dramatic decline in natural gas prices due to the spread of hydraulic fracturing, or fracking, starting about a decade ago – or the incentive that it would provide utilities to phase out coal-fired power plants.

In recent years, solar energy and wind power costs have dropped far faster than expected, also displacing coal – and in some cases natural gas – as a source of energy for electricity generation.

Something we learned during our storage study is illustrative.

We found that lithium ion batteries at 2019 prices were a bit too expensive in North Carolina to compete with natural gas peaker plants – the natural gas plants used occasionally when electricity demand spikes. However, when we modeled projected 2030 battery prices, energy storage proved to be the more cost-effective option.

Credit: The Conversation

Credit: The Conversation

Federal, state and even some local policies are another wild card. For example, Democratic lawmakers have outlined the Green New Deal, an ambitious plan that could rapidly address climate change and income inequality at the same time.

And no matter what happens in Congress, the increasingly frequent bouts of extreme weather hitting the U.S. are also expensive for utilities. Droughts reduce hydropower output and heatwaves make electricity usage spike.

The future

Several utilities are already investing in energy storage.

California utility Pacific Gas & Electric, for example, got permission from regulators to build a massive 567.5 megawatt energy-storage battery system near San Francisco, although the utility’s bankruptcy could complicate the project.

Hawaiian Electric Company is seeking approval for projects that would establish several hundred megawatts of energy storage across the islands. And Arizona Public Service and Puerto Rico Electric Power Authority are looking into storage options as well.

We believe these and other decisions will reverberate for decades to come.If utilities miscalculate and spend billions on power plants it turns out they won’t need instead of investing in energy storage, their customers could pay more than they should to keep the lights through the middle of this century.

The Price of Large-Scale Solar Keeps Dropping

JOHN ROGERS, SENIOR ENERGY ANALYST, CLEAN ENERGY | SEPTEMBER 13, 2018, 11:49 AM EST
View the original article here.

PV modules at the Kerman site near Fresno, California
The latest annual report on large-scale solar in the U.S. shows that prices continue to drop. Solar keeps becoming more irresistible.

The report, from Lawrence Berkeley National Laboratory (LBNL) and the US Department of Energy’s Solar Energy Technologies Office, is the sixth annual release about the progress of “utility-scale” solar. For these purposes, they generally define “utility-scale” as at least 5 megawatts (three orders of magnitude larger than a typical residential rooftop solar system). And “solar” means mostly photovoltaic (PV), not concentrating solar power (CSP), since PV is where most of the action is these days.

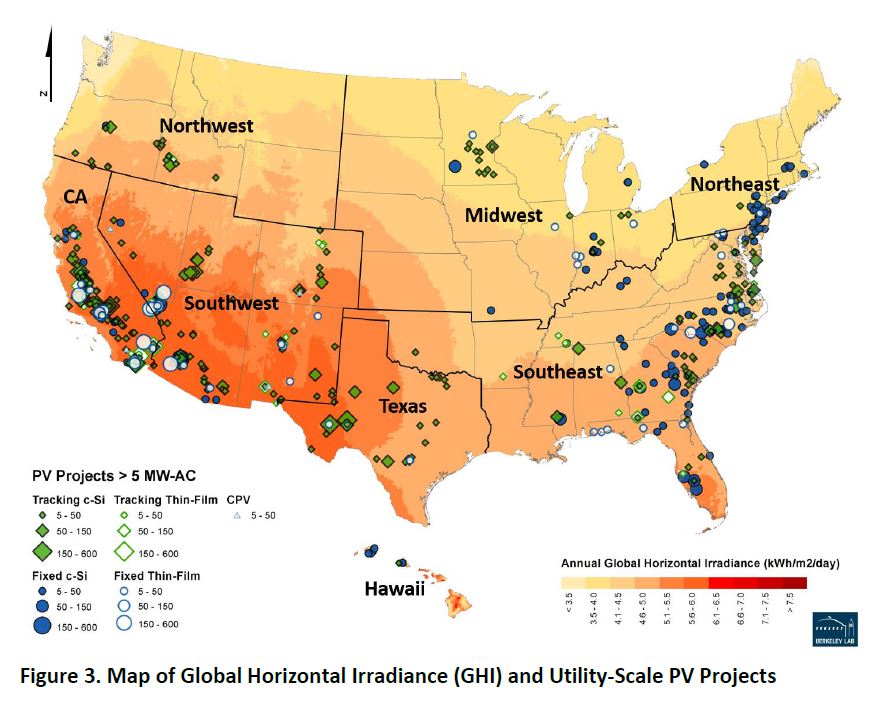
Here’s what the spread of large-scale solar looks like:

Solar Drop 2

In all, 33 states had solar in the 5-MW-and-up range in 2017—four more than had it at the end of 2016. [For a cool look at how that map has changed over time, 2010 to 2017, check out this LBNL graphic on PV additions.]

Watch for falling prices

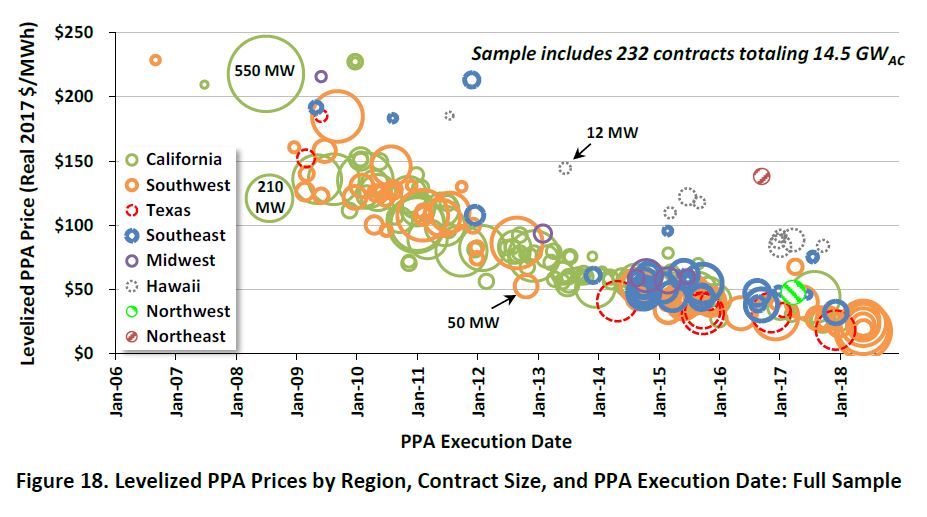
Fueling—and being fueled by—that growth are the reductions in costs for large-scale projects. Here’s a look at power purchase agreements (PPAs), long-term agreements for selling/buying power from particular projects, over the last dozen years:

Solar Drop 3

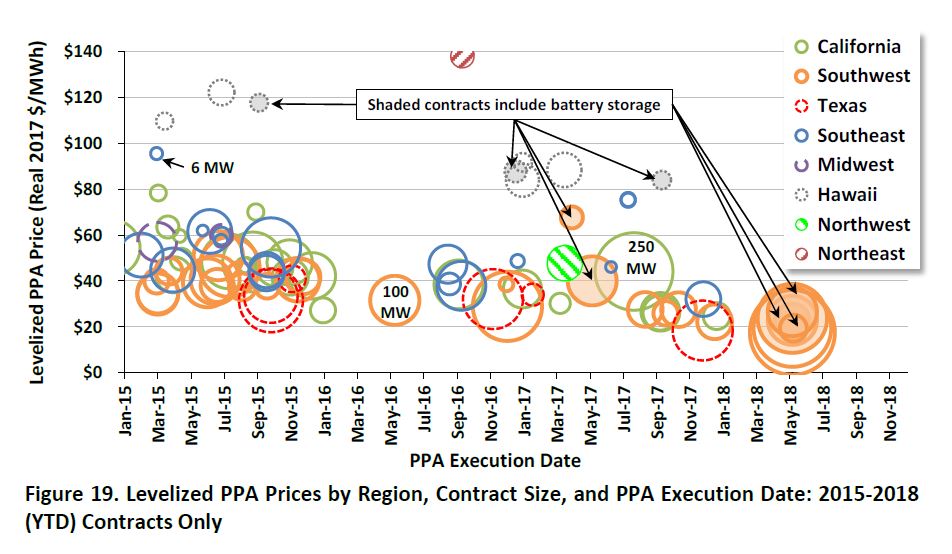
And here’s a zoom-in on the last few years, broken out by region:

Solar Drop 4

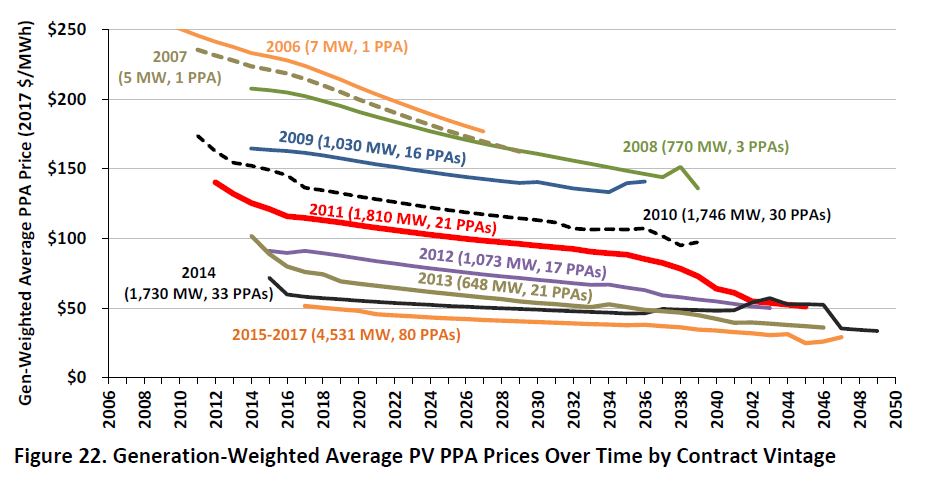
While those graphs show single, “levelized” prices, PPAs are long-term agreements, and what happens over the terms of the agreements is worth considering. One of the great things about solar and other fuel-free electricity options is that developers can have a really good long-term perspective on future costs: no fuel = no fuel-induced cost variability. That means they can offer steady prices out as far as the customer eye can see.

And, says LBNL, solar developers have indeed done that:

Roughly two-thirds of the contracts in the PPA sample feature pricing that does not escalate in nominal dollars over the life of the contract—which means that pricing actually declines over time in real dollar terms.

Imagine that: cheaper over time. Trying that with a natural gas power plant would be a good way to end up on the losing side of the contract—or to never get the project financed in the first place.

Here’s what that fuel-free solar steadiness can get you over time, in real terms:

Solar Drop 5

What’s behind the PPA prices

So where might those PPA price trends be coming from? Here are some of the factors to consider:

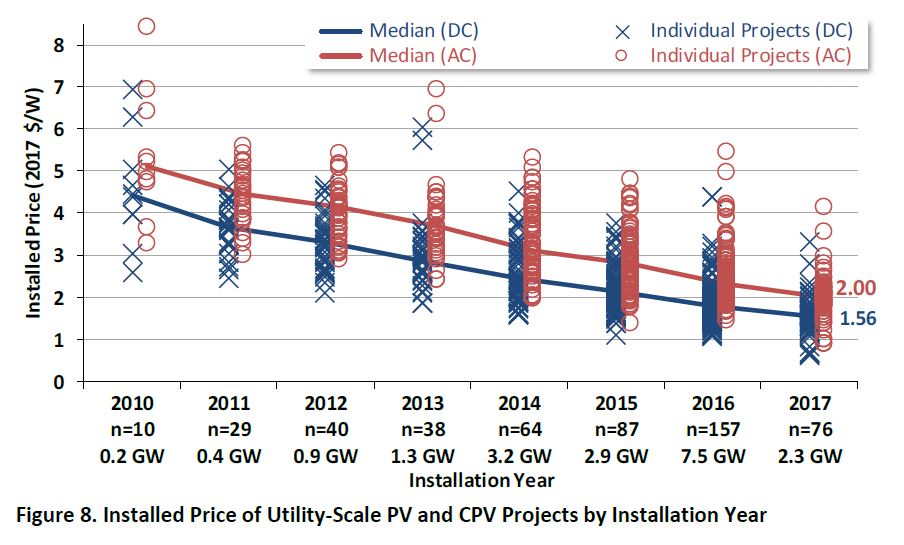
Equipment costs. Solar equipment costs less than it used to—a lot less. PPAs are expressed in cost per unit of electricity (dollars per megawatt-hour, or MWh, say), but solar panels are sold based on cost per unit of capacity ($ per watt). And that particular measure for project prices as a whole also shows impressive progress. Prices dropped 15% just from 2016 to 2017, and were down 60% from 2010 levels.

Solar Drop 6

The federal investment tax credit (30%) is a factor in how cheap solar is, and has helped propel the incredible increases in scale that have helped bring down costs. But since that ITC has been in the picture over that whole period, it’s not directly a factor in the price drop.

Project economies of scale. Bigger projects should be cheaper, right? Surprisingly, LBNL’s analysis suggests that, even if projects are getting larger (which isn’t clear from the data), economies of scale aren’t a big factor, once you get above a certain size. Permitting and other challenges at the larger scale, they suggest, “may outweigh any benefits from economies of scale in terms of the effect on the PPA price.”

Solar resource. Having more of the solar happen in sunnier places would explain the price drop—more sun means more electrons per solar panel—but sunnier climes are not where large-scale solar’s growth has taken it. While a lot of the growth has been in California and the Southwest, LBNL says, “large-scale PV projects have been increasingly deployed in less-sunny areas as well.” In fact:

In 2017, for the first time in the history of the U.S. market, the rest of the country (outside of California and the Southwest) accounted for the lion’s share—70%—of all new utility-scale PV capacity additions.

The Southeast, though late to the solar party, has embraced it in a big way, and accounted for 40% of new large-scale solar in 2017. Texas solar was another 17%.

But Idaho and Oregon were also notable, and Michigan was one of the four new states (along with Mississippi, Missouri, and Oklahoma) in the large-scale solar club. (And, as a former resident of the great state of Michigan, I can attest that the skies aren’t always blue there—even if it actually has more solar power ability than you might think.)

Capacity factors. More sun isn’t the only way to get more electrons. Projects these days are increasingly likely to use solar trackers, which let the solar panels tilt face the sun directly over the course of the day; 80% of the new capacity in 2017 used tracking, says LBNL. Thanks to those trackers, capacity factors themselves have remained steady in recent years even with the growth in less-sunny locales.

What to watch for

This report looks at large-scale solar’s progress through the early part of 2018. But here are a few things to consider as we travel through the rest of 2018, and beyond:

  • The Trump solar tariffs, which could be expected to raise costs for solar developers, wouldn’t have kicked in in time to show up in this analysis (though anticipation of presidential action did stir things up even before the tariff hammer came down). Whether that signal will clearly show in later data will depend on how much solar product got into the U.S. ahead of the tariffs. Some changes in China’s solar policies are likely to depress panel prices, too.
  • The wholesale value of large-scale solar declines as more solar comes online in a given region (a lot of solar in the middle of the day means each MWh isn’t worth as much). That’s mostly an issue only in California at this point, but something to watch as other states get up to high levels of solar penetration.
  • The investment tax credit, because of a 2015 extension and some favorable IRS guidance, will be available to most projects that get installed by 2023 (even with a scheduled phase-down). Even then it’ll drop down to 10% for large-scale projects, not go away completely.
  • Then there’s energy storage. While the new report doesn’t focus on the solar+storage approach, that second graphic above handily points out the contracts that include batteries. And the authors note that adding batteries doesn’t knock things completely out of whack (“The incremental cost of storage does not seem prohibitive.”).

And, if my math is correct, having 33 states with large-scale solar leaves 17 without. So another thing to watch is who’s next, and where else growth will happen.

Many of the missing states are in the Great Plains, where the wind resource means customers have another fabulous renewable energy option to draw on. But solar makes a great complement to wind. And the wind-related tax credit is phasing out more quickly than the solar ITC, meaning the relative economics will shift in solar’s favor.

Meanwhile, play around with the visualizations connected with the new release (available at the bottom of the report’s landing page), on solar capacity, generation, prices, and more, and revel in solar’s progress.

Large-scale solar is an increasingly important piece of how we’re decarbonizing our economy, and the information in this new report is a solid testament to that piece of the clean energy revolution.

PACE for Nonprofit-owned Buildings: Cutting Energy Costs to Serve Communities

By Bracken Hendricks
You can view the original article here.

Every day nonprofit community-based institutions work hard to raise money and deliver mission-driven programs and services. Whether providing affordable housing for the homeless, assisting at-risk youth in gaining job skills in public charter schools, or ministering to the conscience of a community in houses of worship, these institutions regularly push their internal capacity and strain their budgets just to advance a public mission of service.

When choosing to install new energy saving technology like more efficient lighting or boilers, or upgrading to renewable energy with solar panels, the choice too often comes down to a trade-off between using scarce capital resources to either upgrade their physical plant or carry out their mission.

Financing building improvements using Property Assessed Clean Energy (PACE) can enable nonprofits to overcome these upfront cost barriers and easily access capital that is paid for over time through savings on utility bills. PACE offers low interest rates, long terms to minimize payments, and a solid value proposition for mission driven organizations.  That’s a good deal not only for the community, but for local clean energy businesses, the regional economy, and our shared environment.

Today, PACE programs in Washington DC and New York State can provide important lessons to help other communities around the nation access these benefits from what we call “Civic PACE”.  Both Energize NY and Urban Ingenuity are finding that the nonprofit sector is a huge opportunity for clean energy sector growth. Considered part of the commercial building stock, most nonprofits have underinvested in energy related improvements.

These community-based organizations often have constrained budgets, substantial deferred maintenance challenges, and very large unmet capital investment needs.  Nonprofits are typically underserved in debt markets because they have unusual forms of credit or cash flows, making PACE an ideal mechanism to finance building upgrades because it attaches to the land record of the property not the credit of the borrower. For this reason, nonprofit properties frequently have low debt levels, further simplifying PACE underwriting by reducing the need for lender consent to establish a special PACE tax assessment.

Although PACE is a powerful tool for nonprofit institutions, it has not been widely available or accessible to these critical community-based institutions… until now. The cost of capital can be a major factor for institutions that low priced debt. In order to serve this important market, it is essential to structure creative financing solutions that bring down pricing for nonprofits.

With support from the U.S. Department of Energy’s Sunshot Initiative, The Solar Foundation, Urban Ingenuity, and Clean Energy Solutions Inc. (CESI) are working with program administrators across the country to open up the nonprofit market beyond Washington DC. Through outreach and collaboration, the team is working to demonstrate the viability of using PACE with HUD-assisted multifamily housing, the value of PACE-secured PPAs for non-profit solar projects, tax-exempt bond financing considerations, and other creative credit enhancements.  The team is finding opportunities to build this market to use PACE financing to expand deployment of solar energy and energy efficiency projects for nonprofit organizations, working closely with houses of worship and local Public Housing Authorities in Washington DC, New York, and many other communities around the country to make low-cost, long-dated debt and appropriate equity available for PACE projects.

For example, in the District of Columbia, Urban Ingenuity is currently structuring credit enhancements and tax-exempt PACE capital to bring down interest rates. They are currently closing a tax-exempt PACE note at less than 4% for 20 year debt, representing perhaps the first tax-exempt PACE financing, and demonstrating a new potential opportunity for PACE investment.

In New York, Energize NY has used Qualified Energy Conservation Bonds (QECBs) to bring down the cost of clean energy upgrades to under 3% for 20 year funds, as well as offering direct property owner support to help overcome the capacity gap that is a common barrier to upgrades in this sector.  In addition, New Market Tax Credits (NMTC) and other forms of innovative, low-cost capital are available to credit-enhance PACE notes.

Nonprofit owned buildings are not currently well served by solar tax equity markets; these markets are not always transparent for consumers, and the pricing and structure is traditionally designed to benefit the investor and developer, instead of maximizing the flow of resources to advance a non-profit’s mission. The PACE-secured PPA, on the other hand, reduces credit risk, drives transparency in solar markets, and presents improved pricing and terms for customers. DC PACE has proven a “pre-paid PPA” approach, and Energize NY is close to closing three PPA’s with non-profits and others unable to take advantage of federal tax credits.

More broadly, NY State is addressing the challenges facing non-profits and Low and Moderate Income (LMI) housing by supporting Energize NY PACE financing as well as through the State’s energy agency (NYSERDA) and a range of utility initiatives. These efforts combine to form a compelling package that can include direct project support, financing with long-terms and low interest rates, and energy upgrade standards that encourage improvements which provide significant financial gain to LMI housing and other non-profit customers.

The energy burden is disproportionately high for almost all nonprofits and especially for affordable housing owners who struggle with balancing operating needs and serving their mission.  Reducing energy costs and consumption make good financial sense for these property owners, and accessing upfront capital to pay for needed project level investments, paid for over time with utility savings, is one key piece of the solution. Now, with PACE, which can be enhanced through QECBs or other tools and paired with direct incentives, nonprofits can access the capital they desperately need to improve their property while saving money to advance their mission, foster public welfare and a higher quality of life while giving back to communities in ways that extend well beyond greening the environment and protecting global climate.


Five Financial Benefits of Using C-PACE (In Language Your CFO Will Understand…)

By Larry Derrett, Founder, EnFlux Building Solutions
You can view the original publishing of this article here.

CPACE
The C-PACE funding program has grown extensively and has the potential to become a game changer for the funding of energy efficiency projects. The market potential is immense, and the benefits of the program are compelling. But it is relatively underutilized. For the program to accelerate its growth, constant messaging is required for building owners, contractors and legislators to learn about the benefits of the program. Out of all these stakeholders, perhaps the building owner’s CFO is the most important target as they are the key decision maker when considering this type of funding.

My goal here is to provide a snapshot of the financial benefits of using C-PACE. This article is purposefully narrow in scope and is written in the CFO’s language.

C-PACE Testimonial

As of June 30, 2018, building owners have chosen the C-PACE program to fund 1,790 projects. That’s a 75% increase above the 1,020 projects closed through the end of 2016. However, it’s just the tip of the iceberg for C-PACE’s market potential. Financial decision makers all over the US have validated the benefits of C-PACE 1,790 times. That says something about the program.

“As a former CFO, I would not hesitate to recommend C-PACE to the CEO, board or investors. The benefits are compelling.”

Why? Let’s look at five reasons.                                                                     

#1. Increase Net Cash Flow from Efficiency Retrofits

C-PACE funding is repaid through a 20+ year assessment to a building which is collected similarly to traditional property taxes. This causes annual payments to be very low, especially when compared to 5- or 7-year traditional financing. As a result, energy and maintenance savings will exceed the annual C-PACE assessment for virtually any pure efficiency retrofit. In other words, if companies use C-PACE to fund pure equipment retrofits, their cash flow will increase.

The positive net cash flow can also ease the ability of commercial office building owners to pass along the costs and benefits of a retrofit to tenants. That’s because it’s easier to demonstrate savings will cover financing costs spread over 20 years versus a more traditional repayment period of ~ 7 years.

This is a win-win. Building owners receive an upgrade to the building that could last 15 to 20 years. Tenants enjoy lower overall net expenses and a more comfortable work environment.

What is outlined above is reason enough for many to use this type of funding. But that’s just scratching the surface…

#2. No Acceleration of the Assessment

The C-PACE lender is not allowed to accelerate the full amount owing even if a scheduled payment is past due. Only the unpaid amount that has been billed but not paid is recoverable. This is a very small amount when compared to the capital involved in a total debt restructuring. Therefore, it should not carry enough voting power to complicate the restructuring process.

#3. Freedom to Sell the Building

The C-PACE lender does not have approval rights regarding a sale. That’s because the assessment is an attachment to the building and becomes an obligation of the buyer. This eases how owners can optimize holdings, particularly for larger commercial real estate developers.

#4. Absence of Constraints Typically Imposed by a Lender

The C-PACE lender does not impose traditional lender protections such as quarterly reporting, maintenance of debt covenants or similar requirements. There is no need for an inter-creditor agreement and the building owner has one less creditor to deal with in case of a debt restructuring.

#5. Reduced Weighted Average Cost of Capital

This applies primarily to new construction and major renovations where the project is part of a new or restructured capital deck. The concept is simple – to the extent lower cost C-PACE funding can be used in lieu of higher cost equity (common or preferred) or traditional mezzanine debt, it lowers the overall cost of capital to building owners.

As mentioned earlier, an important element in C-PACE’s continued growth is for CFOs to understand the financial benefits of the program. You can help get the word out by sharing this article with financial decision makers in your network. If they are not familiar with C-PACE, they will appreciate the heads up. And please comment below if you have encountered additional financial drivers for embracing C-PACE.

The World’s Biggest Solar Project Comes With a ‘Batteries Included’ Sticker

By Brian Eckhouse and Mark Chediak
View the original article here.

The world’s biggest-ever solar project — a $200 billion venture in Saudi Arabia — comes with a “batteries included” sticker that signals a major shift for the industry.

SoftBank Group Corp. partnered with the oil-rich Saudis this week to plan massive networks of photovoltaic panels across the sun-drenched desert kingdom. The project is 100 times larger than any other proposed in the world, and features plans to store electricity for use when then sun isn’t shining with the biggest utility-scale battery ever made.

The daytime-only nature of solar power has limited its growth globally partly because the cost of batteries was so high. Utilities that get electricity from big solar farms still rely on natural gas-fired backup generators to keep the lights on around the clock. But surging battery supplies to feed electric-car demand have sent prices plunging, and solar developers from California to China are adding storage to projects like never before.

Cheaper Batteries

Costs are expected to drop in half by 2025 as factories ramp up battery production

“The future is pretty much hybrid facilities,’’ said Martin Hermann, the CEO of 8minutenergy Renewables LLC, a U.S. company that’s expecting to include batteries in the vast majority of the 7.5 gigawatts of solar projects it’s developing.

Affordable batteries have long been the Holy Grail for solar developers. Without them, some of the best U.S. solar markets, like California, have too much of electricity available at midday and not enough around dusk when demand tends to peak.

Wind Wins

While the solar industry has grown, it still accounts for less than 2 percent of U.S. electricity supply and has been outpaced by investments in other green technologies. Wind farms are set to overtake hydroelectric plants next year as the biggest source of renewable energy in the U.S., accounting for more than 6 percent of the nation’s electricity generating capacity, government data show.

Now, the economics of storage is shifting. The price of lithium-ion battery packs tumbled 24 percent last year, according to Bloomberg New Energy Finance, and the U.S. is allowing solar-dedicated storage to qualify for a federal tax credit. More utilities and local energy providers are mandating that new solar farms include batteries to store power.

Adding batteries to solar plants could revolutionize the industry. California has contemplated going all-renewable by 2045. It won’t be able to do that without storage, said Kevin Smith, chief executive officer of SolarReserve LLC, a solar project developer that uses molten-salt energy-storage technology.

More Control

“Storage just adds control,” said Logan Goldie-Scot, a San Francisco-based energy storage analyst at BNEF. “In a number of markets, you are seeing customers seeking a greater deal of control.”

By the end of 2018, it’s possible that U.S. utilities may be asking for batteries on every solar project proposed, said Ravi Manghani, an energy analyst at GTM Research. That would mean the country is about to embark on a major battery boom. Only about 1 gigawatt of storage had been installed in the U.S. through the third quarter, according to BNEF.

Several large developers already are proposing storage units as part of their projects, including NextEra Energy Inc.

Cypress Creek Renewables LLC, which builds clean-power plants, is contemplating batteries at every one of its early-stage solar projects, according to Chief Executive Officer Matthew McGovern. The company installed batteries at 12 solar farms last year.

The shift isn’t just in the U.S.

The Saudi-SoftBank project calls for an astonishing 200 gigawatts of generating capacity that would be built over the next decade or so, with the first electricity being produced by the middle of next year. Based on BNEF data, the project would dwarf the total solar panels that the entire photovoltaic industry supplied worldwide last year.

Evening Hours

A key feature of the project will be the construction of “the largest utility-scale battery” in two to three years that will supply “evening hour” power to consumers, Masayoshi Son, SoftBank’s founder, told reporters in New York this week.

Tesla Inc., the Palo Alto, California-based carmaker that’s building batteries with Panasonic at a giant factory in Nevada, will supply the storage units for a solar project in the Australian state of Victoria. Houston-based Sunnova Energy Corp. is selling solar and battery systems in Puerto Rico, where Hurricane Maria devastated the island’s power grid in September and tens of thousands of people still don’t have electricity.

China-based Trina Solar Ltd., once the world’s largest maker of photovoltaic panels, is seeking to invest 3.5 billion yuan ($556 million) in integrated energy projects this year that could include power generation, distribution grids and storage, Vice President Liu Haipen said Wednesday in an interview in Beijing. Most of the investment will be in China, but the company is exploring opportunities in Germany, Spain, Australia and Japan, he said.

Cheaper batteries are even providing a boost in the residential market for solar systems.

“It’s a game-changer,” said Ed Fenster, executive chairman of San Francisco-based Sunrun Inc., the largest U.S. installer of residential solar systems. “The demand that we’re seeing is outstripping our expectations.”

— With assistance by Stephen Cunningham, Vivian Nereim, and Feifei Shen

Promoting Elder Wellness with Artificial Light

Rod Smith

By: Rodney Smith
Director of Energy Independence for Emerald Skyline Corporation
Inventor of Bio-Light


Humans evolved on Earth over thousands of years before the invention of artificial light, under natural light 1conditions of sunlight, moonlight, and a relatively little bit of fire light. These natural light conditions are reflected inthe physical structure of the eye, with cones being tuned to daylight and rods to night time light conditions. Humans are diurnal (daytime) beings, while some other animals are nocturnal, so our normal pattern of wakefulness and activity is during the daytime.

There is another form of light sensor in the eye discovered more recently that does not contribute directly to sight yet plays a role in secretion of melatonin: the intrinsically photosensitive retinal ganglion cells (pRGC).

During the past ten years brain scientists have discovered that in addition to patterns of light being transmitted via the optic nerve to the visual center in the brain, there is also a branch that transmits data regarding light conditions to a command center in the brain called the suprachiasmatic nucleus (SCN).

Light and the Endocrine System

2

The SCN processes the light data and sends command signals to several glands in the endocrine system to either secrete or suppress secretion of certain hormones critical to normal body function. The pineal gland, in the hypothalamus in the brain, suppresses secretion of melatonin in the presence of bright white light, specifically when the SCN has identified a narrow 10 nanometer band of light spectrum (out of 330 nanometers of human visible light spectrum) from 450 to 460 nanometers.


3

Action spectrum for melatonin regulation in humans

When melatonin secretion is suppressed we become more alert. Melatonin secretion normally occurs when exposure to the bright white light diminishes, e.g. at sundown, but only does so if the trigger has been set by bright white light exposure earlier in the day. Melatonin also serves as a powerful antioxidant which floods the body with natural anti-cancer agents while we sleep.1

The adrenal gland is also largely controlled by the SCN based on light conditions in an opposite way from melatonin. Cortisol secretion is stimulated in the presence of bright white light and suppressed normally at night. Cortisol serves as a wake up call to the body, raising our core body temperature, heart rate, and blood pressure from a sleep state, and is also a factor in normal digestion. If the SCN does not signal the adrenal gland to secrete cortisol, we may be tired and listless. Changes in our digestive system could cause abnormal processing of foods especially carbohydrates and can be a factor in hypoglycemia associated with diabetes.3

Light and the Elderly

4People that lack exposure to natural sunlight are the most prone to have issues with mental and physical well-being resulting from abnormal hormonal secretion. Many elderly people lack adequate sunlight exposure. Furthermore the lens of the eye thickens and yellows with age, resulting in a 75% reduction in light passing through the lens by age 75. The yellowing of the lens reduces the blue end of the light spectrum where the circadian rhythm spectrum is found. The result can be sleep deprivation and the many issues that accompany it, including depression and circulatory issues, among others.


Spectral Power Density of GE "Natural Light" Fluorescent tubes

Spectral Power Density of GE “Natural Light” Fluorescent tubes

Unfortunately, traditional lighting does not provide the specific spectrum of light required between 450 and 460 nanometers for normal secretion and suppression of melatonin. Even with specialized “natural” light fluorescent tubes, the required light spectrum actually is at a low point in providing the critical spectrum while there are peaks on either side of the narrow band. The problem of proper light exposure cannot be solved by simply increasing the level of fluorescent light.


Spectral Power Density of LG 5630 LED at 6,500 Kelvin

Spectral Power Density of LG 5630 LED at 6,500 Kelvin


Fortunately, LED lighting is far more controllable in terms of light spectrum as well as in terms of dimming and low glare if well designed. Light being emitted from a source can be measured in spectral power density (SPD) at specific light spectrums measured in nanometers. It is possible to utilize LEDs in a fixture that has a perfect score of 100% SPD at the desired light spectrum. This is important, as the critical light spectrum can be passively delivered at reasonable levels of light in the ambient environment. Previously, light therapy devices required a patient to actively stare into a bright light box for two hours – which is an unpleasant experience to say the least – and not something many elderly residents can be expected to do. Delivery of the needed light spectrum passively will help assure all residents receive the desirable light and do not require active therapy.

If the LED fixture is designed as a side-lit panel, the light is indirect light and a pleasant glow to the eye, even at the higher light levels recommended by the Illuminating Engineering Society (IES) for elder care facilities. With traditional lighting it is very difficult to even achieve the recommended light levels in a tolerable manner, and impossible to provide the critical light spectrum for circadian light. Assuring that elderly residents have adequate light levels to enjoy their interests and hobbies will raise their activity levels and mental engagement.

Screen Shot 2018-02-28 at 5.21.19 PM

Spectral Power Density of LG 5630 LED at 2,700 Kelvin

There is a second part to the required light. While it is critical to have the bright white light especially in the morning, it is equally important to have warmer light with less blue light later in the afternoon and in the evening. If there is only bright white later in the day, melatonin secretion will continue to be suppressed.

LED lends itself to control so with modern wireless radio frequency control systems such as ZigBee, which is an IEEE telecommunication standard widely deployed by electrical power utilities to communicate wirelessly with smart meters and appliance among others, that facilitates implementation of automated lighting controls on a facility-wide basis for such functions as circadian light scheduling. By using an LED light fixture with both bright white and warm diodes, it is possible to control the light so the bright white is provided in the morning when needed and the warm light later in the day.

This is similar to how the light from the sun changes as the evening arrives. Furthermore, a ZigBee telecommunications platform can also connect with low cost light sensors to provide ambient light data to the control system that can adjust the level of intensity of the light as well as provide the capability to control other devices such as window blinds to further reduce energy consumption. The lighting system can also be linked through ZigBee to other automated sensor and control systems, such as fire detection and security systems.

In addition to the host of wellness benefits described above, LED lights can deliver up to 85% reduction in electricity consumption as well as providing maintenance-free lighting for up to 100,000 hours. For a light fixture on 24 hours per day, such as in a hallway, 100,000 hours of operation equals approximately 12 years. Light bulb maintenance is a significant component of facility maintenance and can free-up valuable employees to perform other maintenance tasks.

Recommendations

The flexibility of control of LED technology is arriving at a time when we can put it to good use for those living primarily indoors, as the elderly do. Opportunities now exist to deploy lighting designed to promote healthy endocrine system function. New eldercare facilities should be designed from a lighting perspective to IES standards, and they can also promote wellness of residents. The improved health can delay transition from Independent Living, to Assisted Living, to Skilled Nursing or Memory Care. In addition to the benefit to residents, making the most of LED capabilities can also reduce hospital transports, resulting in healthier bottom lines for operators.

For more information contact Rodney at [email protected] 


Footnotes:

1 The American Cancer Society www.cancer.com

2 Brainard, G.C. et al, Action Spectrum for Melatonin Regulation in Humans: Evidence for a Novel Circadian Photoreceptor, Journal of Neuroscience 21 (2001) 16, pp 6405-6412.

3 The Cortisol Awakening Response-applications and implications for sleep medicine, G.J. Elder, M.A. Wetherell, N.L. Barclay, J.G. Ellis, Sleep Medicine Review 2014 June; 18(3):215-24.

Additional Reading:

Light and Human Health: An Overview of the Impact of Optical Radiation on Visual, Circadian, and Neurobehavioral Responses, Illuminating Engineering Society, M.C. Figueira, G.C. Brainard, S. W. Lockley, V.L. Revell, R. White, TM-18-08, 2008

Lighting for Health: LEDs in the New Age of Illumination, United States Department of Energy, 2014 The Impact of Light in Outcomes in Healthcare Settings, A. Joseph, The Center for Health Design, 2006

CircadianDisturbanceinPatientswithAlzheimer’sDisease,D.A.Weldemichael,G.T.Grossberg, International Journal of Alzheimer’s Disease, 2010

Lighting and the Visual Environment for Senior Living, Illuminating Engineering Society, ANSI/IES RP-28-07, 2007

SIRT1 Mediates Central Control in the SCN by a Mechanism that Decays with Aging, H.C. Chung, L. Guarante, Cell 153, 1448-1460, 2013

The Cortisol Awakening Response in Context, A. Clow, F. Hucklebridge, L. Thorn, International Review of Neurobiology, NIH, 2010; 93: 153-75.

EMERALD SKYLINE PARTNERS WITH UGMO TECHNOLOGIES TO PROVIDE WIRELESS UNDERGROUND MONITORING AND WATER CONSERVATION TO COMMERCIAL PROPERTIES.

South Florida-based Emerald Skyline brings soil moisture data via UgMO wireless sensors to guarantee our clients never over or under water their property. 

“In this economy and water shortage, installing UgMO is one of the smartest things I’ve done…” – Client

from Emerald Skyline Corporation

BOCA RATON, FL, December 18, 2017 – FOR IMMEDIATE RELEASE

Today, Emerald Skyline announced that it has partnered with UgMO Technologies to provide innovative wireless underground soil moisture monitoring and eliminate over and under watering at commercial properties. Together, we provide savings in water, energy, and dollars.

UgMO™ soil sensors are the first wireless sensors that provide data for intelligent irrigation control. In fact, they measure temperature and moisture levels in real time 24 hours a day to allow for watering only in the zones that require water. Reducing landscape irrigation reduces one of the biggest areas of waste for commercial properties. Many commercial properties over-water by 30-to-300%.

This product is easy to install and works with most existing irrigation clocks. The equipment is installed at no cost leaving our clients with no capital investment. Savings can be seen immediately for a low fixed monthly payment that includes service and maintenance for the length of the contract and clients may cancel at any time.

The savings of irrigation water are between 20-80% that translates to high dollar amounts every year. The zone-by-zone intelligence guarantees monetary savings while maintaining the health and appearance of manicured grounds.

“We are always looking for ways to provide superior products and services to meet our clients sustainability and resiliency needs. We are pleased to add UgMO commercial irrigation management systems to Trex Fencing, ChargePoint EV charging stations and Blue Pillar Internet of Things powered by Aurora to the quality products Emerald Skyline provides to our clients and customers.” reports Abraham Wien, LEED AP O+M, Director of Architecture & Environmental Design for Emerald Skyline.

Don’t wait another season to start saving on water with this proven and effective solution for intelligent irrigation, and to raise the bar for environmental stewardship.

To find out more information about UgMO Advanced Irrigation at your building or facility, please contact Abraham Wien at [email protected] or call us (305) 424-8704.

Businesses Are Facing a New Reality. These Are the Ones That Are Succeeding.

They’re taking responsibility for their effect on people and the environment.

By Peter Lacy
View the original article here.

Astrid Stawiarz Getty Images for UN Global Compact

Astrid Stawiarz Getty Images for UN Global Compact

Evidence is mounting to show that the frequency and ferocity of extreme weather events is intensifying on a global scale. From severe droughts to powerful storms, we are living in an increasingly changeable, uncertain, and unpredictable world.

You don’t have to believe in climate change to accept this new reality. Resilience and the ability to manage challenges impacting us and our environment are of far greater importance to both business and society. Take the recent destructive hurricanes in the U.S. and the Caribbean, or the devastating floods in Nepal, India, and Bangladesh that represent a stark example of this new reality and of our growing vulnerability.

The role of business within this new reality is changing. Businesses have a critical role to play in helping solve the challenges we face through providing services and solutions that support society. In fact, businesses that do not adapt their models run the risk of eroding trust and ultimately, forfeiting customer loyalty.

Uncertainty in the world—from extreme events, to declining natural resources, to the changing skills required for employment—gives forward-thinking C-suite leaders an opportunity to adopt conscious capitalism through the incorporation of key elements like trust, collaboration, and stakeholder orientation into day-to-day business practices. And, as consumers increasingly demand that their brands reflect these objectives, companies that want to remain competitive will need to adapt by joining the circular economy.

At its most basic, the circular economy replaces the current wasteful linear economic model. Instead of organizations relying on finite resources, they conduct sustainable business. They find renewable resources. They remove waste at every stage, from sourcing to recycling—creating a business model that restores and regenerates, rather than depletes and throws away. They look at how products are made, who makes them, and where, as well as how those same products are recycled or sustainably retired. In fact, adopting a circular economy model is not simply about products and services but also the way we do business as companies. It presents an opportunity to move beyond simply meeting sustainability standards to a solution that transforms the current model of business and one that can create a competitive advantage for the leaders.

Leading companies are still innovating, but now in a way that takes responsibility for their effect on people, the environment, and the state of our world. And they have realized that—contrary to popular belief—doing so can still be profitable. Accenture research shows a potential $4.5 trillion reward for achieving sustainable businesses by 2030. And a number of companies are already making progress toward this aim.

Rubicon Global, for instance, a pioneering U.S.-based waste management company that connects customers directly with independent waste haulers, is disrupting the current waste disposal model to reduce waste to landfill, while passing on $1 million in savings to its clients across 80,000 locations.

Nike, another leading example, is rapidly transitioning toward its closed-loop vision with a bold target for FY2020: zero waste from contract footwear manufacturing going to landfill or incineration without energy recovery. To date, 70% of all Nike (NKE, -0.43%) footwear and apparel incorporates recycled materials, using 29 high-performance, closed-loop materials made from factory scraps.

As the circular economy and conscious capitalism take hold, the C-suite is taking note: 64% of UN Global Compact CEOs say sustainability issues play a central role in their strategic planning and business development, while 59% of CEOs report that their company can accurately quantify the business value created through their sustainability initiatives, up from 38% in 2013.

The circular economy, a critical aspect of this change, is already happening—so much so that the World Economic Forum Young Global Leaders, in collaboration with Accenture Strategy and in partnership with Fortune, recognize leaders through The Circulars, the world’s leading circular economy award program. The Circulars, presented each year at the World Economic Forum Annual Meeting in Davos, attracts entries from individuals and organizations across business and civil society, from global giants such as Unilever to innovative startups such as Method. A winner at The Circulars in 2015, Method was built on wholly circular and sustainable principles, ensuring 75% of its products are cradle-to-cradle certified, meaning they are designed and produced in a socially and environmentally responsible way. Method has eliminated countless toxic chemicals from homes by using natural inputs.

These are just a few examples of organizations driving value through circular economy innovation—there are many more. In a world in which conscious capitalism is becoming mainstream, the circular economy has a significant role to play in enabling businesses to make the transition whilst continuing to deliver value to customers, shareholders, and society. As more businesses take the lead, the opportunity that the circular economy represents will become a reality.

The rapid growth of electric cars worldwide, in 4 charts

The article below puts a spotlight on the swift growth of electric vehicle use worldwide. So speedy in fact, EV use has tripled since 2013. This is one of the few areas that the world’s nations are on track to keep climate change below 2 degrees celsius. Let this be a reason to keep up the good work with EV deployment, and highlight the other energy initiatives that could use improvement. With every electric vehicle that hits the road, the demand for places to charge up increases. What if I told you there was a way to not only install a charging station, but an independently owned business that can set its own pricing, access settings, and much more? Keep reading to find out…


The rapid growth of electric cars worldwide, in 4 charts

electric vehicle parking

An increasingly common sight

Written by Brad Plumer on June 6, 2016

One million down, another billion or so to go.

In a new report, the International Energy Agency estimates that 1.26 million electric cars hit the world’s roads in 2015, passing a nifty (if symbolic) milestone. Here’s a chart showing the very rapid growth of both battery electric vehicles (BEVs) and plug-in hybrids (PHEV):

evolution global electric car stock

(IEA, Global EV Outlook 2016)BEV = battery electric vehicles; PHEV = plug-in hybrid vehicles, which typically have both an electric motor and a conventional engine.

The United States now has 400,000 electric vehicles on the road — a massive increase since 2010, though well short of Obama’s goal of 1 million by 2015. Meanwhile, China has become the world’s largest market, overtaking the US in annual sales last year.

Is 1 million a lot? It depends how you look at it. It’s jaw-dropping growth given that there were only a few hundred electric vehicles on the entire planet back in 2005. And the total number of electric vehicles worldwide has tripled just since 2013.

But to put this in perspective, there are more than 1 billion gasoline- and diesel-powered cars on the world’s roads — and demand will keep soaring in the decades ahead as China and India’s middle classes expand. So we have a long, long way to go before electric cars take over the world.

In order to avoid more than 2°C of global warming, the IEA calculates, we’d likely need to see about 150 million electric cars on the road by 2030 and 1 billion by 2050 as part of a broader climate strategy. The good news, the agency says, is that this ambitious electric vehicle target seems much more feasible than it did just a few years ago.

Two big reasons for the rapid growth of EVs: public subsidies and falling battery prices

For starters, more and more countries are enacting policies to build up charging infrastructure and incentivize vehicle purchases. The table below details some of those policies, which include everything from tax breaks to tailpipe emission standards (which favor cleaner electric cars) to HOV lane access:

Electric vehicle uptake

IEA, Global EV Outlook 2016

“Ambitious targets and policy support have lowered vehicle costs, extended vehicle range and reduced consumer barriers in a number of countries,” the report says.

As a result, electric vehicles now make up more than 1 percent of sales in China, France, Denmark, and Sweden. They make up 9.7 percent of sales in the Netherlands, and 23 percent of sales in Norway, which offers some of the most generous tax incentives around, worth about $13,500 per car.

The other huge driver here is falling battery costs, which have fallen by a factor of four since 2008. Since batteries make up around one-third of the price of electric vehicles, getting this number down even further is crucial for widespread adoption.

evolution battery energy density cost

IEA, Global EV Outlook 2016

The Department of Energy estimates that battery costs need to fall to $125 per kilowatt-hour by 2022 to achieve cost-competitiveness with conventional vehicles. The IEA says this “seems realistic” given current rates of technological improvement, and points out that manufacturers like Tesla and GM have set even more ambitious cost targets.

The amount of energy that batteries can hold (known as energy density) has also improved significantly. The IEA cites various reports that electric cars will soon be able to travel more than 180 miles on a single charge — also critical for boosting consumer adoption and alleviating “range anxiety.”

Meanwhile, electric cars get all the attention, but the IEA points out that the electrification of other modes of transport, including motorcycles and buses, is just as important. Particularly in countries where these vehicles are widespread:

The electrification of road transport modes other than cars, namely 2-wheelers, buses and freight delivery vehicles, is currently ongoing in a few localised areas. With an estimated stock exceeding 200 million units, China is the global leader in the electric 2-wheelers market and almost the only relevant player globally, primarily because of the restriction on the use of conventional 2- wheelers in several cities to reduce local pollution. China is also leading the global deployment of electric bus fleets, with more than 170 000 buses already circulating today.

To help solve climate change, electric cars need to do much, much more

Here’s one last chart from the IEA, showing what electric car deployment would have to look like to help meet the emissions-reduction promises put forth at the Paris climate talks last year (around 100 million electric cars by 2030). It also shows the even faster deployment that would be needed to keep global warming below 2 degrees Celsius (about 150 million):

deployment scenarios electric cars

IEA, Global EV Outlook 2016

We’re on track now, but it’s early. In fact, as the IEA points out elsewhere, electric vehicle deployment is basically the only area where the world’s nations are on track to hit the targets needed to stay below 2 degrees Celsius.

One final caveat: As David Biello recently explained at Scientific American, electric cars aren’t inherently greener than their gasoline-powered counterparts. If you use coal-fired power plants to charge all those electric cars, the climate benefits are minimal (or, worse, negative). The IEA is well aware of this, although it also notes that electric car deployment can help support the rollout of cleaner renewable energy, too:

The climate change-related benefits of EVs can be fully harvested under the condition that their use is coupled with a decarbonised grid, an additional challenge for countries that are largely dependent on fossil fuels for power generation. Investment in EV roll-out can support this transition, e.g. increasing the opportunities available to integrate variable renewable energy.

Cleaning up the grid is a sine qua non for electric cars to help ameliorate climate change, although this hardly seems like a deal breaker for the technology. Think of it this way: If we don’t clean up the world’s electric grid, we have little chance of stopping global warming either way. The two have to go hand in hand.

End article.


Following Emerald Skyline’s recently announced partnership with ChargePoint, we have realized more and more the importance of the growth of electric vehicle use worldwide. Equally important as these EVs are the charging stations and infrastructure needed to support them. This rapid growth necessitates installation of charging stations. The industry standard for functionality and aesthetics are ChargePoint stations which are independently owned businesses that set their own pricing, access settings and much more.

To find out more information about the installation of a ChargePoint Electric Vehicle Charging Station at your home, office building, shopping center, hotel or transportation hub and join the EV revolution for a greener tomorrow, please contact us at 305.424.8704 or [email protected]

Segregating the cost components of a “real” property allows for optimal cost recovery to increase after tax income

PJ Pictureby Paul L. Jones, CPA, Director, Emerald Skyline Corporation

In the fourth quarter of 1985, Philip Morris Inc. agreed to buy General Foods for an estimated $5.6 billion. At the time, it was the largest food company acquisition in history. Pursuant to this acquisition, Philip Morris had to allocate the purchase price among cash and cash equivalents, real estate, tangible personal property, identifiable intangible assets and, finally, goodwill.

In conjunction with this cost allocation, Kenneth Leventhal & Company, a CPA firm that specialized in real estate, was hired to value the property, plant and equipment and segregate them into real, personal and land improvement assets to establish basis for its tax returns. I was a leader on the team that completed the study and valuation. The project involved hundreds of properties on six continents, the expertise of an untold number of real estate, engineering and accounting professionals – and over a year – to complete.

The reason we segregated the personal property and land improvement assets was to shorten, to the extent possible, the time required, and maximize the deductions from taxable income, to recover the cost of the assets through depreciation resulting in reduced income tax obligations. Accordingly, the primary goal of a cost segregation study is to identify all construction-related costs that can be depreciated over a shorter tax life (typically 5, 7 and 15 years) than the building (39 years for non-residential real property). Personal property assets, consisting of non-structural elements, exterior land improvements and indirect construction costs which are found in a cost segregation study generally include items that are affixed to the building but do not relate to the overall operation and maintenance of the building.

The investment strategy for every rental residential apartment complex and commercial building, including office buildings, shopping centers, industrial facilities, hotels, restaurants, entertainment complexes and all other commercial properties that are being acquired, constructed and/or sustainably renovated to be “Green” should include accelerated depreciation realized from a cost segregation study.

cost-segregationBy increasing the depreciation deduction, current income taxes are reduced and after-tax cash flow increased during the initial years of ownership or completion of substantial sustainable renovations – when their net present value and positive impact on the investor’s internal rate of return is the greatest.

A cost segregation study, in a nutshell, is the process of identifying any personal property and land improvement assets that are grouped with real property assets, and accounting for them separately, in particular, for Federal income tax purposes. The determination of what property components qualify for shorter depreciable lives as personal property is ultimately based on asset-specific facts and circumstances. However, consultants rely heavily on precedents existing in both case law and IRS guidance.

The law, rules and procedures relied upon in cost segregation studies have been around since the enactment of the Investment Tax Credit (ITC) in 1962 which established the legal rationale used to distinguish personal from real property for purposes of the ITC and provides the framework for the same classification process in cost segregation studies.

While the ITC was repealed through the Tax Reform Act of 1986, a landmark tax court decision in the case of Hospital Corporation of America (“HCA”) vs. Commissioner, 109 TC 21 issued in 1997 upheld the application of cost segregation for differentiating the depreciable basis of real, personal and land improvement assets. The HCA case is the seminal case for cost segregation studies and the IRS has agreed that a taxpayer can use a cost segregation study to segregate building costs. Critical to the Tax Court’s analysis was that in formulating accelerated depreciation methods, Congress intended to distinguish between components that constitute IRC section 1250 class property (real property) and property items that constitute section 1245 class property (tangible personal property). This distinction opened the doors to cost segregation.

Armed with this victory, taxpayers have increasingly begun to use cost segregation to their advantage. The IRS reluctantly agreed that cost segregation does not constitute component depreciation (action on decision (AOD) 1999-008). Moreover, cost segregation recently was featured in temporary regulations issued by the Treasury Department (regulations section 1.446-1T). In a chief counsel advisory (CCA), however, the IRS warned taxpayers that an “accurate cost segregation study may not be based on non-contemporaneous records, reconstructed data or taxpayers’ estimates or assumptions that have no supporting records” (CCA 199921045).

Real property eligible for cost segregation includes buildings that have been purchased, constructed, expanded or remodeled since 1987. A cost segregation study is typically cost-effective for buildings purchased or remodeled at a cost greater than $750,000. These studies are most efficient for new buildings recently constructed, but they can also uncover retroactive tax deductions for older buildings, which can generate significant short benefits due to “catch-up” depreciation.

Property owners should consider using a cost segregation study if they:

  • Acquired property in the last 15 years
  • Recently completed or started a construction project
  • Inherited property from an estate and received a stepped-up basis
  • Purchased a partnership share
  • Expect to pay income taxes
  • Plan on holding the property for at least five years

Examples of assets that may qualify to be reclassified as Section 1245 property (tangible personal property) which have shorter depreciable lives include:

  • Land improvements (drainage and irrigation systems, fencing, outdoor lighting, landscaping, parking lots and walkways, etc.);
  • Ornamental fixtures;
  • Wall and floor coverings;
  • Security systems;
  • Cabinets and millwork;
  • Data and communication cabling;
  • Decorative lighting;
  • Window treatments;
  • Production machinery;
  • Electrical and plumbing service to specific equipment;
  • Energy management systems;
  • Equipment, machinery and equipment that meet the “sole justification test” (i.e., building system components the sole justification for the installation of which is the fact that such equipment….are essential for the operation of other machinery or the processing of materials or used in connection with research of experimentation); and
  • Moveable wall partitions, catwalks and mezzanines

According to IRS Publication 544: “The fact that the structure is specially designed to withstand the stress and other demands of the property and cannot be used economically for other purposes indicates it is closely related to the use of the property it houses. Structures such as oil and gas storage tanks, grain storage bins, silos, fractionating towers, blast furnaces, basic oxygen furnaces, coke ovens, brick kilns, and coal tipples are not treated as buildings, but as section 1245 property.”

In distinguishing between a building’s tangible personal property and structural components, Jay Soled and Charles Falk in a 8/1/2004 article entitled “Cost Segregation Applied” in the Journal of Accountancy, “CPAs, engineers and consultants will find the courts to be a final source of guidance. In Whiteco Industries, Inc. v. Commissioner (65 TC 664 (1975)), for example, the Tax Court set forth the following six questions that can use to determine whether property is inherently permanent and thus a structural component excluded from the definition of tangible personal property:

  • Can the property be moved? Has it been moved? (For example, a shed with a concrete floor vs. a shed with a wooden floor.)
  • How difficult is removal of the property, and how time-consuming is it? (For example, a wine cellar vs. a prefabricated photo-processing lab.)
  • Is the property designed or constructed to remain permanently in place? (For example, a wooden barn vs. a wire chicken coop.)
  • Are there circumstances that tend to show the expected or intended length of affixation—or that the property may or will have to be moved? (For example, permanent concrete pilings vs. floating docks that can be removed in the winter.)
  • How much damage will the property sustain upon its removal? (For example, a steel-encased bank vault vs. an easily removable lighting system attached by bolts.)
  • How is the property affixed to the land? (For example, permanently glued bathroom tile vs. removable billboard.)

Even with ample regulatory, legislative and judicial guidance, making the distinction between tangible personal property and a building’s structural components remains a challenge for CPAs. No bright-line test exists. What is fortunate, however, is that many of the factual issues involving properties of different sorts have been litigated, and their outcomes illuminate the direction a court confronted with similar facts is likely to take.”

The primary property recovery periods are:

  • Buildings = 27.5 years for residential and 39 years for commercial
  • Land Improvements = 15 years
  • Furniture, fixtures & equipment = 7 years
  • FF&E, Retail & service = 5 years
  • Information systems = 5 years

Cost segregation consultants generally employ one of two methods, or a combination of both, that have approved by the IRS:

The first approach is to obtain and examine actual cost data records and construction documents in conjunction with a site visit to identify assets for potential reclassification. This approach is typically used when the property has been recently constructed and documents are readily available. The consultant assigns costs to each component based on any information provided, analysis of the documents and site visit.

The second approach, applicable when the original construction documentation is not available, is typically performed when a study is performed in conjunction with the purchase of the property. This alternative is also performed when the cost segregation study is conducted several years after initial construction. In applying this approach, an engineer or consultant will analyze architectural drawings, mechanical and electrical plans and other blueprints to segregate the structural and general building electrical and mechanical components from those linked to personal property. Using standard construction cost estimating tools, the property is “reverse-engineered” into its separate components. The consultant will also allocate “soft costs,” such as architect and engineering fees, to all components of the building. Total actual property costs are then allocated to the components on a proportional basis.

The information and documents typically required for a cost segregation study include:

  • legal description of the property
  • Date placed in service
  • Building and land area
  • Survey
  • Architectural and building plans
  • AIA documents 702 & 703
  • Other construction documents and accounting records
  • Depreciation schedules
  • Fixed asset listing
  • Construction loan documents, if available
  • Settlement statement
  • Appraisal

The consultant provides a self-contained cost segregation report, certified by the study’s authors, that will satisfy IRS requirements.

The benefits can be significant. BKD LLP, CPAs calculates that “Each $100,000 in assets reclassified from a 39-year recovery period to a five-year recovery period results in approximately $16,000 in net-present-value savings, assuming a 5% discount rate and a 35% marginal tax rate.

By reclassifying an asset from building (1250) to personal property (1245) property, the magnitude of an additional allowance in the first year can be enormous. For example, a shift of $1 million from 39-year property to 5-year property can augment first-year depreciation deductions by a whopping $575,000 ($25,000 vs. $600,000). Note: The application of the alternative minimum tax may reduce some of the tax savings associated with cost segregation.

Cost segregation studies should be performed by consulting firms with expertise in engineering, construction, tax and accounting. The IRS’ underlying assumption in determining what constitutes a quality study is that the study is performed by “personnel competent in the design, construction, auditing, and estimating procedures relating to building construction.”

Emerald Skyline Corporation, whose principals include real estate, sustainability, resiliency, architecture and accounting professionals is uniquely qualified to provide cost segregation advisory services to building owners, investors, managers and accountants in conjunction with your sustainability and resiliency project. Each cost-segregation study prepared by Emerald Skyline includes an identification of any available Green Building Tax incentives. Often overlooked, these valuable tax credits can amount up to 30% of qualified expenditures and increase the tax benefits of a cost segregation study.