Utilities

Utilities are starting to invest in big batteries instead of building new power plants

By Jeremiah Johnson and Joseph F. Decarolis
View the original article here.
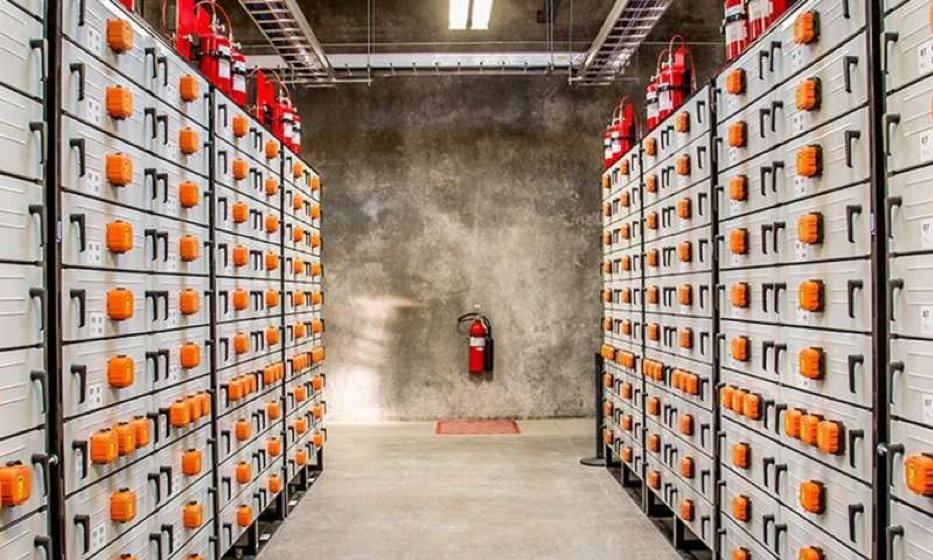
This is what a 5-megawatt, lithium-ion energy storage system looks like. Credit: Pacific Northwest National Laboratory

This is what a 5-megawatt, lithium-ion energy storage system looks like. Credit: Pacific Northwest National Laboratory

Due to their decreasing costs, lithium-ion batteries now dominate a range of applications including electric vehicles, computers and consumer electronics.

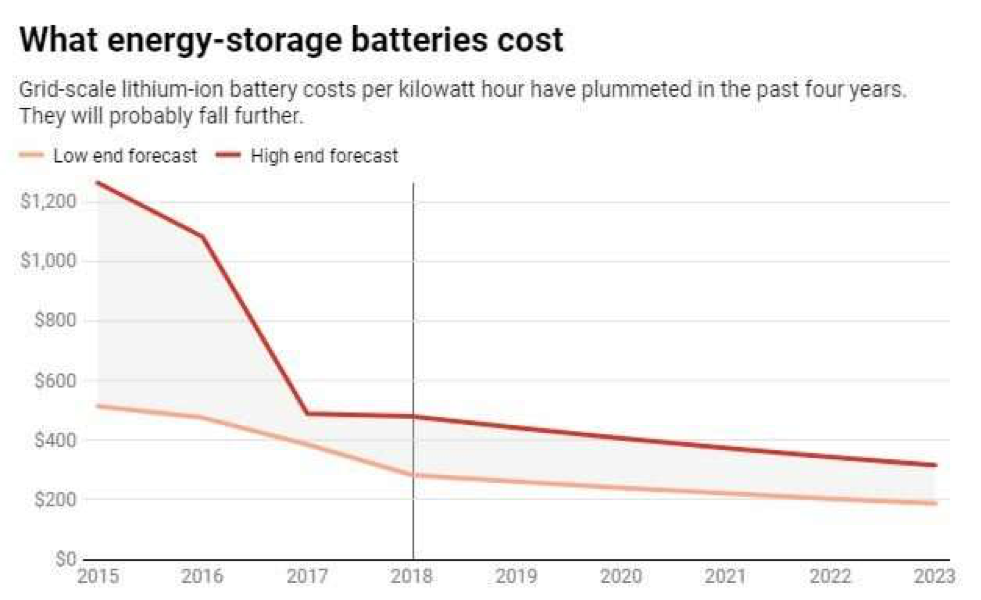
You might only think about energy storagewhen your laptop or cellphone are running out of juice, but utilities can plug bigger versions into the electric grid. And thanks to rapidly declining lithium-ion battery prices, using energy storage to stretch electricity generation capacity.

Based on our research on energy storage costs and performance in North Carolina, and our analysis of the potential role energy storage could play within the coming years, we believe that utilities should prepare for the advent of cheap grid-scale batteries and develop flexible, long-term plans that will save consumers money.

Peak demand is pricey

The amount of electricity consumers use varies according to the time of day and between weekdays and weekends, as well as seasonally and annually as everyone goes about their business.

Those variations can be huge.

For example, the times when consumers use the most electricity in many regions is nearly double the average amount of power they typically consume. Utilities often meet peak demand by building power plants that run on natural gas, due to their lower construction costs and ability to operate when they are needed.
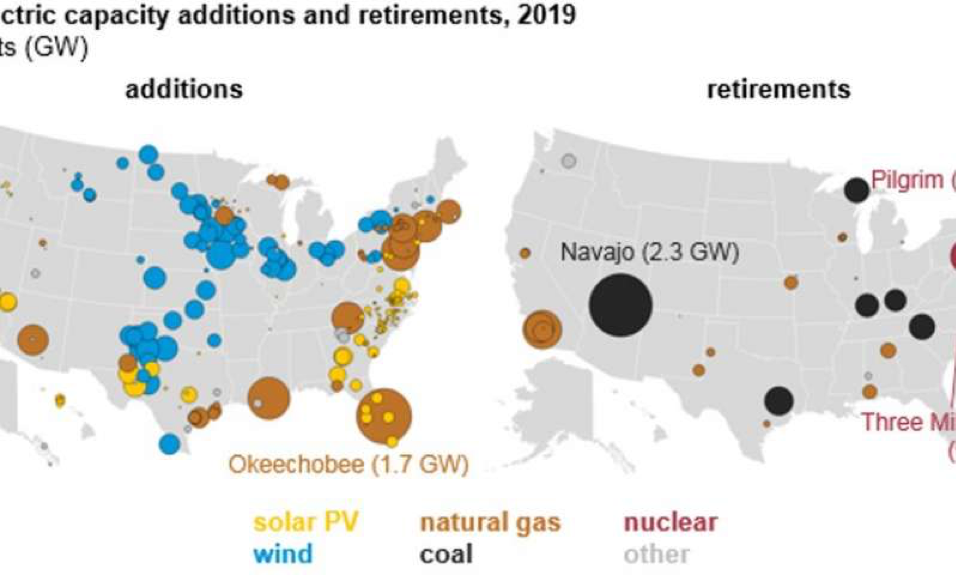
All of the new utility-scale electricity capacity coming online in the U.S. in 2019 will be generated through natural gas, wind and solar power as coal, nuclear and some gas plants close. Credit: U.S. Energy Information Administration

All of the new utility-scale electricity capacity coming online in the U.S. in 2019 will be generated through natural gas, wind and solar power as coal, nuclear and some gas plants close. Credit: U.S. Energy Information Administration

However, it’s expensive and inefficient to build these power plants just to meet demand in those peak hours. It’s like purchasing a large van that you will only use for the three days a year when your brother and his three kids visit.

The grid requires power supplied right when it is needed, and usage varies considerably throughout the day. When grid-connected batteries help supply enough electricity to meet demand, utilities don’t have to build as many power plants and transmission lines.

Given how long this infrastructure lasts and how rapidly battery costs are dropping, utilities now face new long-term planning challenges.

Cheaper batteries

About half of the new generation capacity built in the U.S. annually since 2014 has come from solar, wind or other renewable sources. Natural gas plants make up the much of the rest but in the future, that industry may need to compete with energy storage for market share.

In practice, we can see how the pace of natural gas-fired power plant construction might slow down in response to this new alternative.
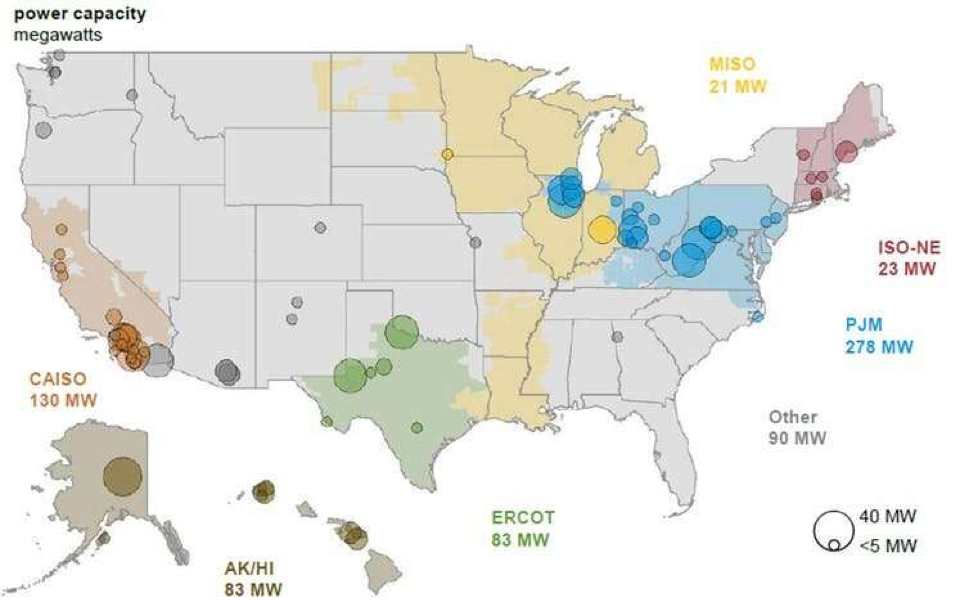
Grid-scale batteries are being installed coast-to-coast as this snapshot from 2017 indicates. Credit: U.S. Energy Information Administration, U.S. Battery Storage Market Trends, 2018.

Grid-scale batteries are being installed coast-to-coast as this snapshot from 2017 indicates. Credit: U.S. Energy Information Administration, U.S. Battery Storage Market Trends, 2018.

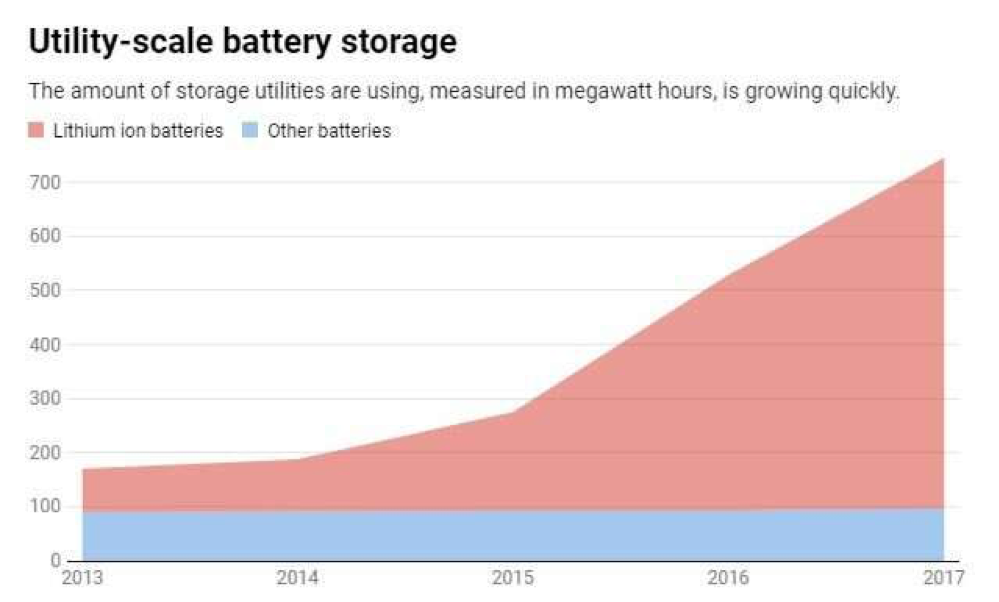
So far, utilities have only installed the equivalent of one or two traditional power plants in grid-scale lithium-ion battery projects, all since 2015. But across California, Texas, the Midwest and New England, these devices are benefiting the overall grid by improving operations and bridging gaps when consumers need more power than usual.

Based on our own experience tracking lithium-ion battery costs, we see the potential for these batteries to be deployed at a far larger scale and disrupt the energy business.

When we were given approximately one year to conduct a study on the benefits and costs of energy storage in North Carolina, keeping up with the pace of technological advances and increasing affordability was a struggle.

Projected battery costs changed so significantly from the beginning to the end of our project that we found ourselves rushing at the end to update our analysis.

Once utilities can easily take advantage of these huge batteries, they will not need as much new power-generation capacity to meet peak demand.

Credit: The Conversation

Credit: The Conversation

Utility planning

Even before batteries could be used for large-scale energy storage, it was hard for utilities to make long-term plans due to uncertainty about what to expect in the future.

For example, most energy experts did not anticipate the dramatic decline in natural gas prices due to the spread of hydraulic fracturing, or fracking, starting about a decade ago – or the incentive that it would provide utilities to phase out coal-fired power plants.

In recent years, solar energy and wind power costs have dropped far faster than expected, also displacing coal – and in some cases natural gas – as a source of energy for electricity generation.

Something we learned during our storage study is illustrative.

We found that lithium ion batteries at 2019 prices were a bit too expensive in North Carolina to compete with natural gas peaker plants – the natural gas plants used occasionally when electricity demand spikes. However, when we modeled projected 2030 battery prices, energy storage proved to be the more cost-effective option.

Credit: The Conversation

Credit: The Conversation

Federal, state and even some local policies are another wild card. For example, Democratic lawmakers have outlined the Green New Deal, an ambitious plan that could rapidly address climate change and income inequality at the same time.

And no matter what happens in Congress, the increasingly frequent bouts of extreme weather hitting the U.S. are also expensive for utilities. Droughts reduce hydropower output and heatwaves make electricity usage spike.

The future

Several utilities are already investing in energy storage.

California utility Pacific Gas & Electric, for example, got permission from regulators to build a massive 567.5 megawatt energy-storage battery system near San Francisco, although the utility’s bankruptcy could complicate the project.

Hawaiian Electric Company is seeking approval for projects that would establish several hundred megawatts of energy storage across the islands. And Arizona Public Service and Puerto Rico Electric Power Authority are looking into storage options as well.

We believe these and other decisions will reverberate for decades to come.If utilities miscalculate and spend billions on power plants it turns out they won’t need instead of investing in energy storage, their customers could pay more than they should to keep the lights through the middle of this century.

Developing a Water Management Plan

PJ Picture

By Paul L. Jones, CPA, LEED Green Associate
Director, Financial Advisory Services for Emerald Skyline Corporation

Water conservation has become a major source of savings for major industrial corporations:

  • Intel is installing a water recycling project at its Ronler Acres campus in Hillsboro, Oregon. When complete, the facility will have the potential to recycle over a billion gallons of water annually while improving the quality of water that leaves the facility.
    • Since 1998, Intel has conserved more than 52 billion gallons of water. In 2015, it saved 820 million gallons of water in Oregon through water conservation efforts.
  • Cummins, the engine manufacturer, has beaten its water conservation goal – to reduce water use intensity by 33% by 2010 – by achieving a 42% reduction in the third quarter of 2016.
    • As a result, it has increased its facility water goal to a 50% intensity reduction by 2020 from a baseline of 2010. This revised goal represents a total water savings of 763 million gallons since the 2010 benchmark was established.
  • Ford Motor Co. has instituted water saving technologies at its Chicago Assembly Plant that aims to re-use 90% of water used in the pre-treatment process, reducing the need to use Chicago city water.
    • Late last year, Ford updated its manufacturing water strategy which calls for an additional 30% reduction in water use per vehicle from 2015 to 2020 along with a long-term aspirational goal of zero drinkable water use in manufacturing.
    • The company saved 10 billion gallons of water between 2000 and 2015, a decrease of 61% – by implementing new water-saving technologies in the manufacturing process.

A successful water management program starts with a comprehensive strategic plan. The process for developing a strategic plan is generally the same for an individual facility or an organization. The plan provides information about current water uses and charts a course for water efficiency improvements, conservation activities, and water-reduction goals. A strategic plan establishes the priorities and helps a site or organization allocate funding for water-efficiency projects that provides the biggest impact. Based on information from the Department of Energy, this article describes the general steps Emerald Skyline Corporation uses to create a water management plan for its clients.

Step 1 – Set an Overarching Policy and Goals

To develop a comprehensive strategic plan, the facility or organization should set specific water use reduction targets. The strategic plan should also include senior management support for water efficiency. This can be done in two ways:

  • Provide a written policy statement that ties water efficiency to the long-term operating objective of the facility or organization
  • Provide staff and financial resources to track water use, maintain equipment, and implement cost-effective water use reduction projects.

Step 2 – Access Current Water Uses and Costs

Understanding the current water uses and costs is essential to a comprehensive plan. This step involves collecting water and cost data and determining a baseline that will be used to calculate cost savings and determine overall water reduction potential associated with water-efficiency opportunities.

At the facility level, this task includes performing the following steps:

  • Determine the marginal per-unit cost of water and sewer service
  • Verify the appropriate rate structure is applied
  • Identify services the utility might provide to help manage water efficiently.

Utility information should include the following for potable and non-potable water, we obtain:

  • Contact information for all water and wastewater utilities
  • Current rate schedules and alternative schedules that are appropriate for a particular use or facility type to ensure the best rate
  • Copies of water and sewer bills for the past two years to identify inaccuracies and ensure the appropriate rate structure is applied
  • Information about rebates or technical assistance from the utilities to help with facility water planning and implementing water-efficiency programs. Energy utilities often offer assistance with water-efficiency programs
  • Production information if the facility produces its water or treats its own wastewater, or both.

After collecting water use data, we take the following steps:

  • Determine a baseline annual water use for a specific year or an average water use over several years. If monthly data are available, plot the monthly use over time. Is water use increasing, decreasing, or steady?
  • Try to determine what caused the major trends. Is there a seasonal pattern to water use? This is often the case when irrigation water is used or cooling water demand increases in the summer months. Analyzing the data in this way will help you understand current water use trends.

At the organization level, this step involves collecting detailed water use and cost data and real property inventory from all sites. When collecting this information, consider that you need to separately gather data about potable water use and industrial, landscaping, and agricultural water use (primarily non-potable water) that is associated with reduction targets.

Step 3: Develop a Water Balance

An important step in creating a water management plan is to establish a water balance for the facility or organization. A water balance compares the total water supply baseline (determined in Step 2) to water that is used by equipment and applications.

Estimate Water End Uses


Determining water use at the equipment or application level can be challenging. Most facilities have metered data for total water supply but may have limited or no sub-metering data about component uses. The following five steps outline the process for determining water use at the equipment level:


  • We create an inventory of all water-using activities using the Federal Energy Management Program’s (FEMP) best management practices(BMPs) list as a starting place to identify major equipment types (available upon request from Emerald Skyline Corp. or at the following link: https://energy.gov/eere/femp/best-management-practices-water-efficiency). During the audit, we tap the expertise of others at the facility who have direct knowledge of building mechanical systems and process equipment to generate a complete inventory.
  • We perform a walk-through audit of the facility to identify all significant water-using processes and associated operating characteristics. As part of the walk-through audit, we note the operating schedule, flow rate, model number, and condition for each piece of equipment. If need be, we also use a bucket and stopwatch and make a quick, rough estimate of equipment flow rate (e.g., faucets, showerheads, and once-though cooling). During the walk-through, we pay particular attention to drain lines that are plumbed to floor drains in building mechanical spaces and utility chases.


We trace these back to the originating equipment to make sure they are accounted for in the water balance.


  • For all water uses in the inventory, we obtain any available sub-metered data to help quantify the particular uses
  • Evaluate any seasonal patterns and compare them to the inventory of uses. Are any uses seasonal, such as cooling tower use or irrigation? The seasonal pattern of water use (peak use) can help quantify these uses
  • For unmetered water end uses, we create engineering estimates of water use. For example, estimate:
  • Water use from plumbing fixtures (toilets, urinals, faucets, and showerheads) based on the number of occupants and daily use per occupant
  • Cooling tower use based on cooling capacity and load factor (see BMP #10)
  • Irrigation water use based on irrigated area and inches of water applied
  • Operating equipment water use based on water use per cycle and frequency of cycles.

Develop the Water Balance


We can now create a water balance with the quantified water uses by major equipment type. Compare the sum of the end-use water consumption to the total supply. The difference between these two values represents the “losses” in the system (see figure). These losses may be a result of:


  • Water leaks in the distribution system or equipment
  • Inaccuracies in the engineering estimates used to determine equipment water use
  • Accounting errors such as poorly calibrated meters or unit conversion problems. If the losses are more than 10% of the total water supply, further investigation is probably warranted to determine the cause of the imbalance. This may include a comprehensive leak detection program.

This process will enable us to uncover the high-water-use activities, which will help you prioritize water-saving opportunities.

Step 4 – Assess Water Efficiency Opportunities and Economics

Based on the outcome of the water balance, the next step is to find ways to increase water efficiency and reduce water use. Use the FEMP BMPs for water efficiency as a starting point to identify operations and maintenance, retrofit, and replacement options for:


After we identify the water efficiency opportunities, we perform an economic analysis to determine if the projects are life cycle cost-effective. In this analysis, use the marginal water and sewer rates identified in step 2. We also include other related costs, such as energy and operations and maintenance changes, which resulted from the measure. For example, faucet and shower head retrofits save energy by reducing hot water use (and the electricity to heat the water).

We use the Building Life Cycle Cost Programs software to determine the economics of energy and water projects. Also, we determine the annual escalation rate of the marginal cost of water to escalate water costs in the future.

We ensure water supply, wastewater, storm water issues, and water efficiency BMPs are taken into account at the earliest stages of planning and design for renovation and new construction.  We recommend developing equipment specifications that target water-efficient products so they are automatically purchased for retrofits, renovations, and new construction. As an example, NASA’s Marshall Space Flight Center implemented a product specification for water-efficient plumbing products.

Step 5- Develop an Implementation Plan

After identifying water efficiency projects that you want to pursue, we build an implementation plan which you may want to use this plan to:

  • Assign teams to be responsible for implementation
  • Prioritize projects based on targeted end uses
  • Project a date for installing efficiency measures
  • Project annual water use based on implemented efficiency projects
  • Identify potential funding sources. 

The implementation plan should predict if water goals can be met by the site or organization by implementing cost-effective water-efficiency measures. The plan should also include education and outreach efforts for the building occupants to help reduce water use.


Often, a major hurdle in the planning process is finding funding for projects. Emerald Skyline will work on your behalf to identify sources of water efficiency rebates and project financing. 

Step 6 – Measure Progress


Afterwards, as evidenced by the reports of Intel, Cummins and Ford, it is important to regularly review the strategic plan to make sure measures are implemented and goals are realistic and are being accomplished.


A key element of good water management is tracking water use. Install sub-meters on water-intensive processes, such as cooling towers and irrigation systems, to help manage these processes better and meet annual reporting requirements. You should assign someone to be responsible for tracking ongoing water use. Continue to plot total water use as new water bills become available. Also plot any available sub-metered data. Evaluate trends and investigate and resolve any unexpected deviations in water use. Track water use reductions and publicize your success.


Step 7 – Plan for Contingencies

Consider including water emergency and drought contingency plans that describe how your facility or organization will meet minimum water needs during emergency, drought, or other water shortages. Consider assessing the site for future water availability risks that are associated with climate change. At the organization level, this information can be used to target sites that have or may have water availability risks to help prioritize sites for funding water-efficiency projects.


Information Source


The Office of Energy Efficiency & Renewable Energy within Federal Energy Management Program provides a detailed description for the development of a Water Management Plan (https://energy.gov/eere/femp/developing-water-management-plan) including Best Management Practices (“BMP”) water efficiency. The information provided is appropriate for both private and public facilities.

How you can help make Florida the Sunshine State again

Julie

By Julie Lundin, LEED-AP ID+C,
Principal, Emerald Skyline Corporation 


Florida is undeniably sunny. “The Sunshine State” was adopted as the State Nickname in 1970. It is used on FL_Sunshinemotor vehicle licenses, welcome signs and marketing campaigns. While Florida promotes itself as the Sunshine State we are not utilizing our most abundant and natural resource, solar power.

What is solar power? It is energy from the sun that is converted into thermal or electrical energy. Solar energy is the cleanest and most abundant renewable energy source available. The U.S., including Florida, provides some of the richest solar resources in the world. Only two other states, California and Texas, have more rooftop solar power potential than Florida, according to the U.S. Department of Energy. Based on Florida’s size, rebounding economy and growing population our state should be a leader in the generation and promotion of solar energy.

So why isn’t Florida a solar energy leader?

The reason is simple: Florida’s large utility monopolies and lawmakers have worked successfully to block and control who can generate solar energy and what it can be used for; thereby restricting its use by homeowners and businesses. Florida utility monopolies exist today due to a law that was created over 100 years ago which was trying to avoid a tangle of power lines strung up by competing companies.  This same law restricts solar companies from installing solar panels on roofs and selling back electricity. It is considered a third party sale and is illegal in Florida.

  • Florida is now only one of four states in the nation that prohibit citizens from buying electricity from companies that will put solar panels on a building.

Due to the influence and power of Florida’s utility monopolies, there is a large effort to discourage renewable energy in the state. The large utilities are afraid of losing their monopoly and the lucrative profits that the government guarantees them. Recently lawmakers, at the direction of the utility companies, gutted the State’s energy savings goals and entirely eliminated Florida’s solar-rebate program.

Floridians should have access to solar power and free market choices. We should be allowed to contract directly with solar providers to power our homes and businesses with solar energy. We are currently being denied the right to choose solar as a power source. The free market and competition benefits all of us. Solar energy makes financial sense. That is why business leaders in America’s brightest, most competitive companies are increasingly choosing to install solar energy systems at their facilities. The price of solar energy has fallen dramatically over the past few years while the price of fossil fuel generation continues to experience volatility. America’s businesses are turning to solar power because it’s good for their bottom line.

  • According to a report by the Solar Energy Industries Association, Walmart is the top corporate user in the United States with 105 MW installed at 254 locations.
  • The average price of an installed commercial PV (photovoltaic) project in 2Q2014 was 14% less than the cost in 2013 and was over 45% less than it cost to complete in 2012.

Electricity costs represent a significant operating expense, and solar provides the means to reduce costs and hedge against electricity price increases.

  • The Solar Means Business report noted that the top 25 companies for solar capacity had more than 569 MW of solar PV at 1,110 different facilities in a survey conducted last August. These results represent a 28% increase over the prior year and a 103% increase over 2012.

Clearly, solar power is a great untapped resource for the Sunshine State – one that can benefit residents as well as businesses. It is time to enable Floridians to have unfettered access to this inexpensive energy source – and you can help in the process:

The Florida resident-led solar group, Floridians for Solar Choice, is seeking to make solar more accessible in the state. They are seeking your signature on a ballot petition.

  • The petition seeks to expand solar choice by allowing customers the option to power their homes or businesses with solar power and chose who provides it to them.

Floridians for Solar Choice have reached 72,000 signatures on their petition which clears the way for it to be reviewed by Florida’s Supreme Court.

  • The Supreme Court will decide whether or not the petitions language legally qualifies it to be a ballot initiative for Floridians in 2016.

Getting its petition on the 2016 ballot is the main goal for Floridians for Solar Choice. They need over 600,000 more signatures to have this critical citizen initiative to be put on the ballot for next year.

Please visit their website to learn about the solar initiative to remove this legal barrier to making Florida the Sunshine State again, and, more importantly, to sign the petition, go to: www.FLsolarchoice.org.