The original article was written by the Carbon Brief Staff on 8/10/18. You can view it here.
Earlier today in South Korea, the Intergovernmental Panel on Climate Change (IPCC) published its long-awaited special report on 1.5C.
The IPCC is a body of scientists and economists – first convened by the United Nations (UN) in 1988 – which periodically produces summaries of the “scientific basis of climate change, its impacts and future risks, and options for adaptation and mitigation”.
The reports are produced, in the first instance, to inform the world’s policymakers.
In this detailed Q&A, Carbon Brief explains why the IPCC was asked to produce a report focused on 1.5C of global warming, what the report says and what the reaction has been…
Why did the IPCC produce this special report?
For many years, limiting global warming to no more than 2C above pre-industrial levels was the de-facto target for global policymakers. This was formalised when countries signed the Cancun Agreements at the UN’s climate conference in Mexico in 2010.
However, at the climate talks in Bonn in May 2015, the UN published a new report that warned that the 2C limit was not adequate for avoiding some of the more severe impacts of climate change.
The report – a product of a two-year “structured expert dialogue” (SED) involving more than 70 scientists – found that 2C of warming was not a “guardrail up to which all would be safe”. Instead, it recommended that while “science on the 1.5C warming limit is less robust, efforts should be made to push the defence line as low as possible”.
The findings of the SED subsequently fed into the working draft that would form the Paris Agreement. In December 2015, 195 countries endorsed the agreement, which backed a long-term goal to limit global temperature rise to “well below 2C” and to “pursue efforts towards 1.5C”.
As part of the text of the agreement, the UN Convention on Climate Change (UNFCCC) “invited” the IPCC “to provide a special report in 2018 on the impacts of global warming of 1.5C above pre-industrial levels and related global greenhouse gas emission pathways”.
The IPCC accepted this invitation following a meeting in Nairobi in April 2016 and then drafted an outline of the report at their Geneva gathering in August of the same year. This outline was rubber-stamped two months later at a meeting in Bangkok.
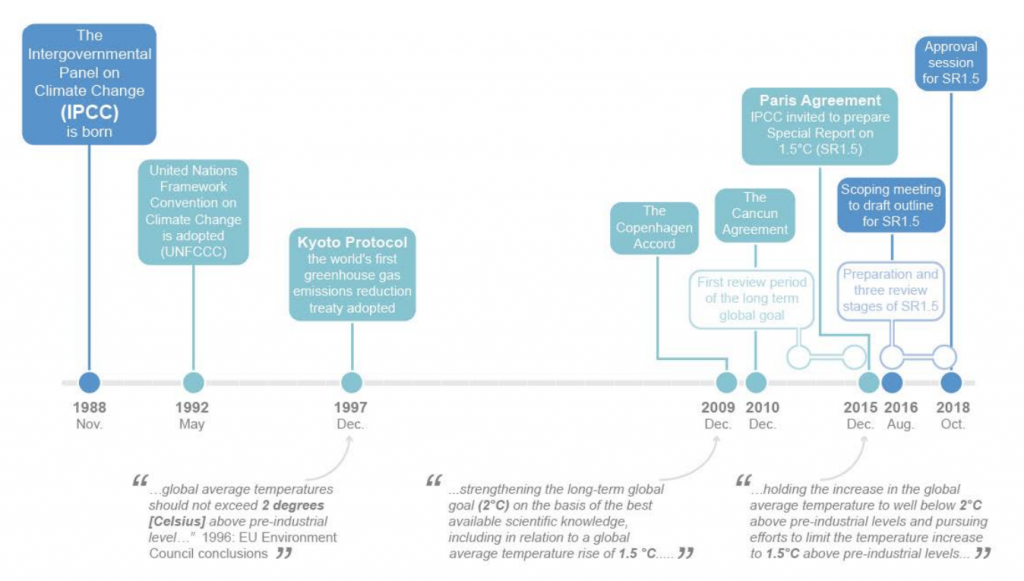
A timeline of notable dates in preparing the 1.5C special report (shaded blue) embedded within processes and milestones of the UNFCCC (grey). Credit: IPCC (pdf)
The author team (pdf) for the report – including review editors – was made up of 91 scientists and policy experts drawn from 44 nationalities. The country most represented was the US with seven authors, followed by Germany with six and the UK with five.
The report, published today following a week-long meeting in Incheon in South Korea, draws on scientific literature from across all three of the IPCC’s “working groups”. However, the authoring was led by the technical support unit of the IPCC’s Working Group I (WG1), which focuses on assessing the physical scientific basis of the climate system and climate change.
The report writing process began with a first author meeting in Sao José dos Campos, Brazil, in March 2017. Three author meetings, three report drafts and 42,000 reviewer comments later, the final report was submitted.
The report has two main parts: a full technical report and a short summary for policymakers (SPM). The wording of the latter was agreed line-by-line by government delegates last week in Incheon. Following the approval of the SPM, there are some updates that need to be made to the full report to ensure it is consistent with the revised SPM. These have not been yet made and so the individual chapters are subject to changes listed in the “trickle-back” document (pdf).
How far away is 1.5C of warming?
Global average temperatures have already warmed by around 1C since pre-industrial times (taken as 1850-1900 by the IPCC). However, the rate of warming is not consistent across the Earth’s surface, as the SPM notes:
“Warming greater than the global annual average is being experienced in many land regions and seasons, including two to three times higher in the Arctic. Warming is generally higher over land than over the ocean.”
In fact, chapter one (pdf) of the report notes that 20-40% of the global population live in regions that have already experienced warming of more than 1.5C in at least one season.
This is illustrated in a group of maps found in the same chapter, which show regional warming (in 2006-15) as an annual average and for the winter and summer seasons. The red and purple shading highlights that much of the high latitudes in the northern hemisphere have already exceeded the 1.5C of warming.
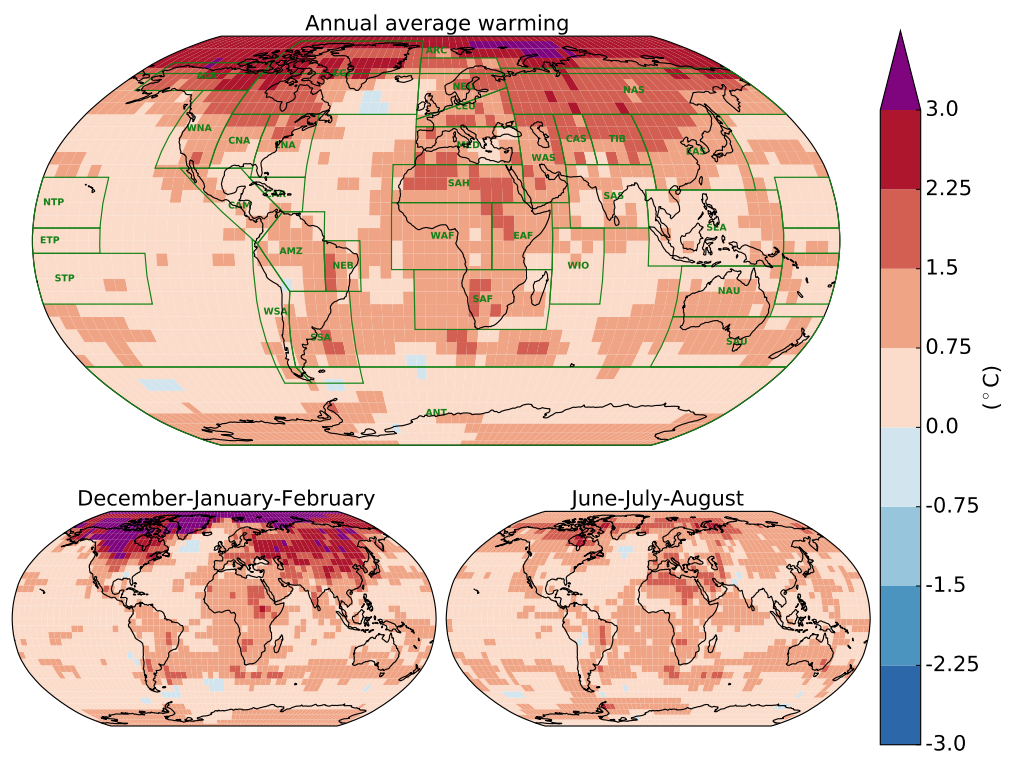
Maps of regional human-caused warming for 2006-15, relative to 1850-1900, annual average (top), the average of December, January and February (bottom left) and for June, July and August (bottom right). Shading indicates warming (red and purple) and cooling (blue). Credit: IPCC (pdf)
Around 100% of this warming is the result of human activity, the SPM says:
“Estimated anthropogenic global warming matches the level of observed warming to within ±20%.”
At current rates, human-caused warming is adding around 0.2C to global average temperatures every decade. This is the result of both “past and ongoing emissions”, the report notes.
If this rate continues, the report projects that global average warming “is likely to reach 1.5C between 2030 and 2052”.
Note that this is not referring to the first time that global average temperatures in a single year hit 1.5C above pre-industrial levels. Natural influences in the global climate – such as variability in the oceans – could temporarily tip temperatures beyond the 1.5C limit. (Similarly, factors such as a large volcanic eruption could suppress global temperatures in the short term.) What the special report is referring to is the point where long-term, human-caused warming reaches 1.5C, with these natural influences taken out.
This is illustrated in the chart from the SPM below, which shows global temperatures, relative to pre-industrial levels. The black line shows the fluctuations of global monthly temperatures to date, which includes the influence of natural variability. The red line shows the estimate of human-caused warming, which shows a more gradual increase. The grey, blue and purple shading illustrate different pathways to keeping warming to no more than 1.5C in 2100.
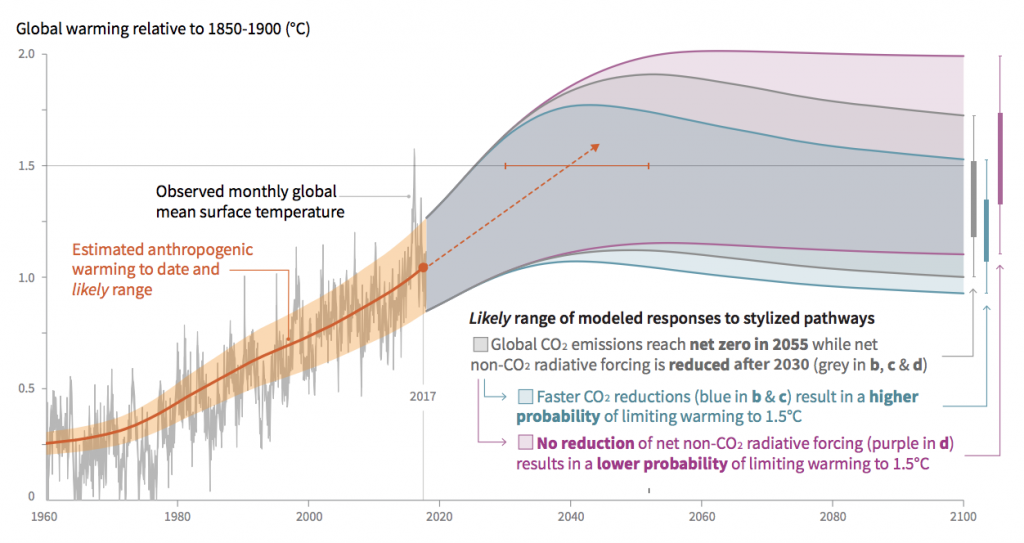
Chart shows observed monthly temperatures (black line), estimated human-caused warming (red), and idealised potential pathways to meeting 1.5C limit in 2100 (grey, blue and purple). All relative to 1850-1900. Credit: IPCC (pdf)
Past greenhouse gas emissions are unlikely to be enough by themselves to push global warming from 1C to 1.5C in the coming decades, the report notes, meaning that if emissions stopped today, the 1.5C limit would not be breached.
However, at the same time, the global emissions to date “will persist for centuries to millennia”, the report says, “and will continue to cause further long-term changes in the climate system, such as sea level rise, with associated impacts”.
(To see how every part of the world has already warmed – and could continue to warm under a range of different scenarios – see Carbon Brief’s new searchable map.)
How do the impacts of climate change compare between 1.5C and 2C?
Since the inclusion of the 1.5C limit in the Paris Agreement, there has been something of a flurry of research into the impacts of 1.5C of warming on the planet.
In fact, as Prof Piers Forster – professor of physical climate change at the University of Leeds and a lead author on chapter two of the special report – wrote in a Carbon Brief guest post at the end of the Paris talks, “climate scientists were caught napping” by the 1.5C limit:
“Before Paris, we all thought 2C was a near-impossible target and spent our energies researching future worlds where temperatures soared. In fact, there is still much to discover about the specific advantages of limiting warming to 1.5C.”
In a recent interactive article, Carbon Brief presented the findings of around 70 peer-reviewed studies showing how the potential impacts of climate change compare at 1.5C, 2C and beyond. The data covers a range of impacts – such as sea level rise, crop yields, biodiversity, drought, economy and health – for the world as a whole, as well as specific regions.
In the special report on 1.5C, chapter one (pdf) notes that climate impacts are already being observed on land and ocean ecosystems, and the services they provide:
“Temperature rise to date has already resulted in profound alterations to human and natural systems, bringing increases in some types of extreme weather, droughts, floods, sea level rise and biodiversity loss, and causing unprecedented risks to vulnerable persons and populations.”
The people that have been most affected live in low- and middle-income countries, the report says, some of whom have already seen a “decline in food security, linked in turn to rising migration and poverty”. Small islands, megacities, coastal regions and high mountain ranges are also among the most affected, the report adds.
In general – and, perhaps, unsurprisingly – the potential impacts of global warming “for natural and human systems are higher for global warming of 1.5C than at present, but lower than at 2C”, the SPM says. The risk are also greater if global temperatures overshoot 1.5C and come back down rather than if warming “gradually stabilises at 1.5C”.
There are a lot of impacts to consider, which is reflected in the fact that chapter three(pdf) on impacts is the longest of the whole report at 246 pages.
In many cases, the IPCC has “high confidence” that there is a “robust difference” between impacts at 1.5C and 2C – such as average temperature, frequency of hot extremes, heavy rainfall in some regions and the probability of drought in some areas.
As an illustration, the report includes a “reasons for concern” graphic that shows how the risks of severe impacts varies with warming levels. The example below shows a section of this graphic showing some of these impacts. The coloured shading indicates the risk level, from “undetectable” (white) up to “very high” (purple).
The graphic shows how warm water corals and the Arctic are particularly at risk from rising temperatures, moving into the “very high” category with 1.5C and 2C of warming, respectively.
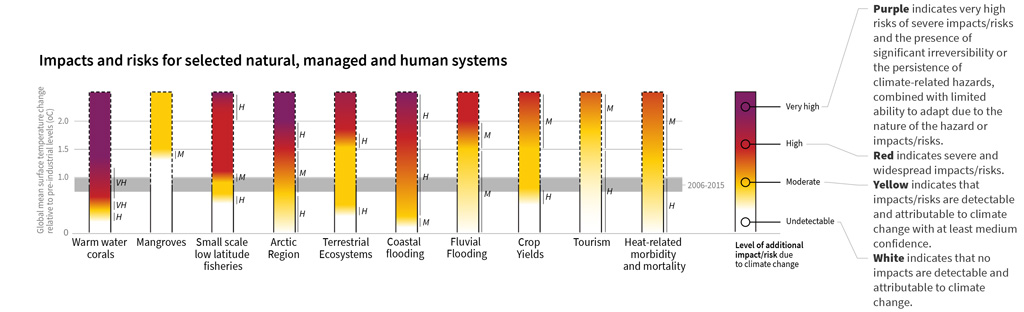
How the level of global warming affects impacts and/or risks associated for selected natural, managed and human systems. Adapted from IPCC (pdf)
Tropical coral reefs actually get their own specific section in Box 3.4 in chapter three, which emphasises that at 2C of warming, coral reefs “mostly disappear”. However, even achieving 1.5C “will result in the further loss of 90% of reef-building corals compared to today”, the report warns. And short periods (i.e. decades) where global temperatures overshoot 1.5C before falling again “will be very challenging to coral reefs”.
For the Arctic, the report expects that “there will be at least one sea-ice free Arctic summer out of 10 years for warming at 2C, with the frequency decreasing to one sea-ice-free Arctic summer every 100 years at 1.5C”. Interestingly, the report also notes that overshooting 1.5C and coming back down again would “have no long-term consequences for Arctic sea-ice coverage”.
Warming of 1.5C will also see weather extremes become more prevalent across the world, the report says. Increases in hot extremes are projected to be largest in central and eastern North America, central and southern Europe, the Mediterranean region, western and central Asia, and southern Africa. Holding warming to 1.5C rather than 2C will see around 420 million fewer people being frequently exposed to extreme heatwaves, the report notes.
High and low extremes in rainfall are also expected to become more frequent, the report says. The largest increases in heavy rainfall events are expected in high-latitude regions, such as Alaska, Canada, Greenland, Iceland, northern Europe and northern Asia. Whereas in the Mediterranean region and southern Africa, for example, “increases in drought frequency and magnitude are substantially larger at 2C than at 1.5C”.
For global sea levels, increases are projected to be around 0.1m less at 1.5C than at 2C come the end of the century, the report notes, which would mean that “up to 10.4 million fewer people are exposed to the impacts of sea level globally”. However, sea levels will continue to rise beyond 2100, the report says, and there is a risk that instabilities in the Greenland and Antarctic ice sheets triggered by 1.5–2C of warming cause “multi-metre” increases in sea levels in the centuries and millennia to come.
Sea level rise is particularly pertinent for the risks facing small island states, which are covered in Box 3.5. The combination of rising seas, larger waves and increasing aridity“might leave several atoll islands uninhabitable” under 1.5C, the report warns.
Another topic given its own specific box is food security (“Cross-Chapter Box 6”), which is affected in various different ways by climate change, the report says:
“Overall, food security is expected to be reduced at 2C warming compared to 1.5C warming, due to projected impacts of climate change and extreme weather on crop nutrient content and yields, livestock, fisheries and aquaculture, and land use (cover type and management).”
Climate change can exacerbate malnutrition by reducing nutrient availability and quality of food products, the report notes. However, in general, “vulnerability to decreases in water and food availability is reduced at 1.5C versus 2C, whilst at 2C these are expected to be exacerbated, especially in regions such as the African Sahel, the Mediterranean, central Europe, the Amazon, and western and southern Africa”.
How quickly do emissions need to fall to meet the 1.5C limit?
Not all 1.5C limits are made equal. In model simulations that translate emissions into atmospheric greenhouse gas concentrations – and, ultimately, to future warming – different emissions pathways take different routes to staying below 1.5C in 2100.
The special report broadly separates these pathways into two categories, as the Frequency Asked Questions section (pdf) of the report explains:
“The first involves global temperature stabilising at or below before 1.5C above pre-industrial levels. The second pathway sees warming exceed 1.5C around mid-century, remain above 1.5C for a maximum duration of a few decades, and return to below 1.5C before 2100. The latter is often referred to as an ‘overshoot’ pathway.”
The charts below illustrate the difference, with an “overshoot” pathway on the left and a stabilisation pathway on the right.
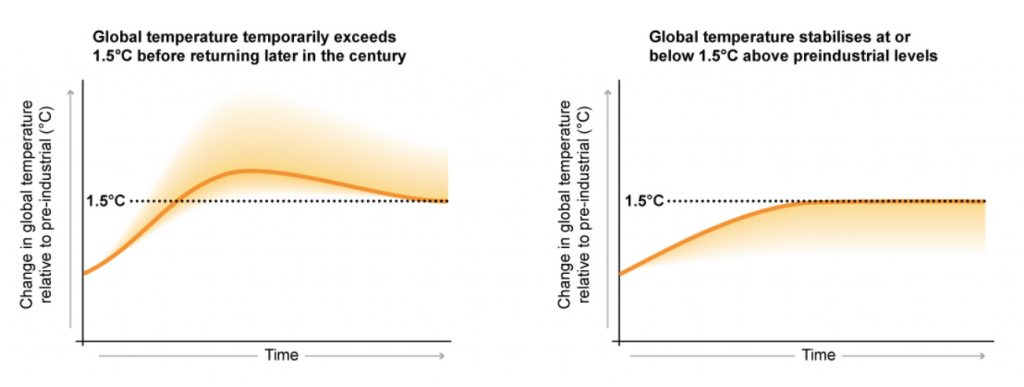
Two main pathways for limiting global temperature rise to 1.5C: stabilising warming at, or just below, 1.5C (right) and warming temporarily exceeding 1.5C before coming back down later in the century (left). Credit: IPCC (pdf)
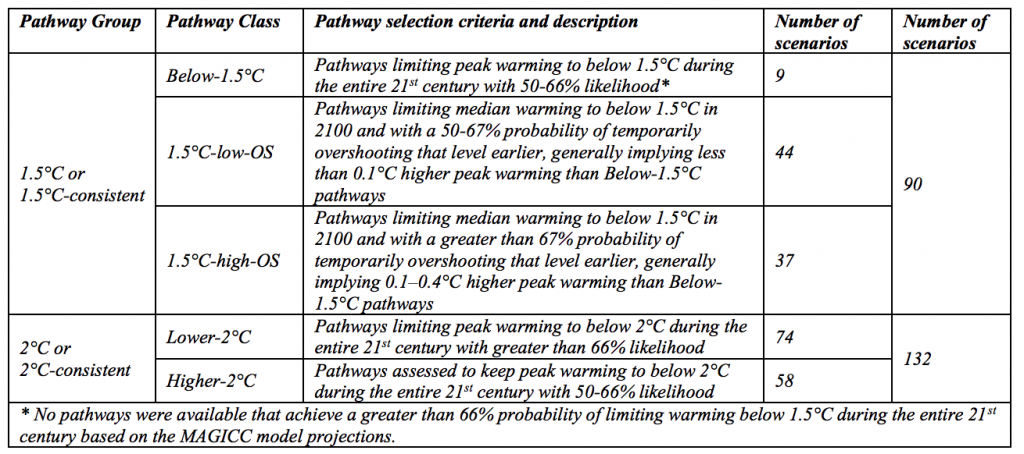
Below, as the table from chapter two (pdf) shows, the emissions scenarios used in the report fall into different categories, according to how much they overshoot 1.5C. Notably, only nine of the 90 1.5C scenarios stay below 1.5C for the entire 21st century. The other 81 all overshoot at some point.
This issue led the European Union to reportedly argue last week that overshoot scenarios should not count as aligned with the Paris Agreement’s 1.5C limit.
According to the SPM, in order to limit warming to 1.5C with “no or limited overshoot”, net global CO2 emissions need to fall by about 45% from 2010 levels by 2030 and reach “net zero” by around 2050.
In other words, by the middle of this century, the CO2 emitted by human activities needs to be matched by the CO2 deliberately taken out of the atmosphere through negative emissions techniques, such as afforestation and bioenergy with carbon capture and storage (BECCS).
For 2C, CO2 emissions will need to decline by about 20% by 2030 and reach net zero around 2075.
Both the 1.5C and 2C limits would also need similar “deep reductions” in non-CO2 emissions, such as methane and nitrous oxide, the SPM adds.
The graphic below illustrates how steeply CO2 emissions (left) and non-CO2 emissions (right) need to fall for 1.5C. The blue lines and shading show examples of pathways that meet the 1.5C limit with little (0-0.2C) or no overshoot, while the grey shows those where temperatures have a “high” temporary overshoot before coming back down again.
The requirement to reach net zero by 2050 is the same for future pathways with and without overshoot, chapter two notes.
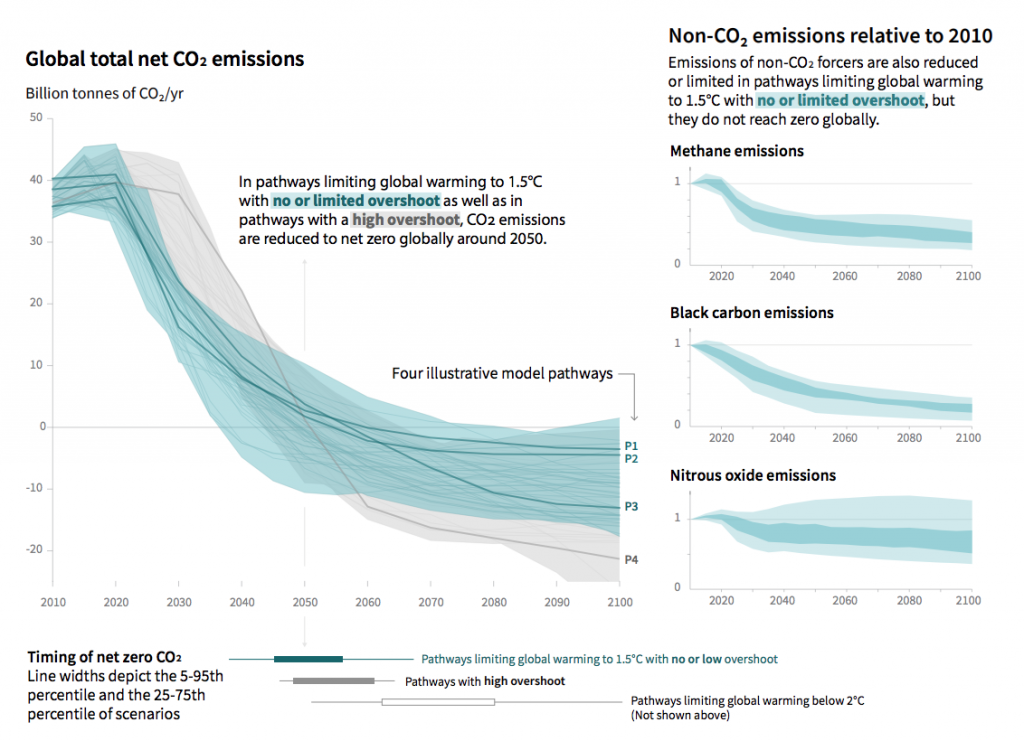
Illustration of the timings of net zero for CO2 for meeting the 1.5C limit under “no or limited overshoot” (blue) and “high overshoot” (grey) scenarios. Also shown are emissions reductions required for methane, black carbon and nitrous oxide (right). Credit: IPCC (pdf)
So, how do current ambitions to cut emissions compare with these targets?
As part of the Paris Agreement, individual countries and the EU submitted pledges to reduce their emissions, known as “Nationally Determined Contributions”, or “NDCs”. These commitments run up to 2025 or 2030, with the intention that ambition is “ratcheted up” through the century.
However, as they stand, the cumulative emissions reductions are some way off the pathway to 1.5C, says chapter two:
“Under emissions in line with current pledges under the Paris Agreement, global warming is expected to surpass 1.5C, even if they are supplemented with very challenging increases in the scale and ambition of mitigation after 2030.”
Essentially, following such a relatively slow pace of emissions cuts for the next decade or so would would mean emissions need to drop to net zero even earlier – by 2045. And even if that were achieved, holding warming to 1.5C would still not be guaranteed.
As an FAQ from chapter two concludes:
“With the national pledges as they stand, warming would exceed 1.5C, at least for a period of time, and practices and technologies that remove CO2 from the atmosphere at a global scale would be required to return warming to 1.5C at a later date.”
What would it take to limit warming to 1.5C?
Cutting emissions to meet a 1.5C limit would require “rapid and far-reaching transitions” across the global economy, the SPM says.
These transitions would need to transform the way energy is used and the sources it comes from; the way land use and agricultural systems are organised; and the types and quantities of food and material that are consumed. The summary continues:
“These systems transitions are unprecedented in terms of scale, but not necessarily in terms of speed, and imply deep emissions reductions in all sectors, a wide portfolio of mitigation options and a significant upscaling of investments in those options.”
The details of these transformations are set out in more detail in the 113-page chapter two (pdf) of the report and a 99-page technical annex (pdf), based on research using integrated assessment models (IAMs). These IAMs combine different strands of knowledge to explore how human development and societal choices interact with and affect the natural world.
(See Carbon Brief’s in-depth explainer on IAMs for more on what they are and the ways they are limited.)
One “key finding”, says chapter two of the report, is that there are many different ways to meet the 1.5C limit under a wide spread of assumptions about future human and economic development. These pathways reflect different futures in terms of global politics and societal preferences, implying different trade-offs and co-benefits for sustainable development and other priorities.
However, all 1.5C pathways share certain features, including CO2 emissions falling to net-zero and unabated coal use being largely phased out by mid-century. They also include renewables meeting the majority of future electricity supplies, with energy use being electrified and made more efficient.
Investment in unabated coal is “halted” by 2030 in “most” 1.5C pathways, says chapter two. It adds:
“Some fossil investments made over the next few years – or those made in the last few – will likely need to be retired prior to fully recovering their capital investment or before the end of their operational lifetime.”
These changes are even more stark for the electricity sector, which is “virtually full[y] decarbonised…around mid-century”. This means that by 2050, coal use in the power sector falls to “close to 0%” and renewables supply 70-85% of the electricity mix.
Not including bioenergy, renewable deployment in 1.5C pathways increases between six and 14-fold by 2050, compared to 2010. Nuclear energy use increases in “most” 1.5C pathways, the report says – but not in all of them.
In addition, 1.5C pathways all include deep cuts in other greenhouse gases, such as a 35% reduction in methane emissions below 2010 levels by 2050.
“The energy transition is accelerated by several decades in 1.5C pathways compared to 2C pathways,” chapter two explains.
In addition to shifting to zero-carbon electricity, extra reductions in 1.5C versus 2C pathways come mainly from transport and industry, it says, with emissions from industry falling 75-90% below 2010 levels by 2050.
Furthermore, energy demand is tempered to a greater degree by efforts to improve end-use efficiency.
It is worth noting that IAMs have a well-known bias towards technological solutions, such as switching the source of energy supply or adding carbon capture and storage(CCS). Scientists have started to explore other ways to limit warming to 1.5C, for example by radically changing the way energy is used.
Finally, it is worth adding that IAM pathways are only really able to explore what is technically feasible. As explained in a lengthy section of chapter one of the report, this is distinct from what is socially, environmentally, politically or institutionally feasible.
Though some aspects of these broader questions are explored in chapter four (pdf), the report does not – and cannot – say whether it will, ultimately, be possible to avoid 1.5C of warming.
What does the report say about the remaining carbon budget for 1.5C?
One of the key tools that scientists have used in recent years to communicate the urgency of cutting emissions to meet the 1.5C limit is the idea of a “carbon budget”. This is essentially the amount of CO2 the human activity can emit into the atmosphere and still hold warming to the 1.5C limit.
Based on estimates made in the IPCC’s most recent assessment report (“AR5”), published in 2013-14, there were around 120 gigatonnes of CO2 (GtCO2) remaining in the budget from the beginning of 2018 for a 66% chance of avoiding 1.5C warming. That is equivalent to just three years of current global emissions.
However, since AR5 was published, a number of new research papers using different methods have suggested that the 1.5C is actually substantially larger. And as the remaining budget for 1.5C is – by any measure – relatively small, the choice of approach can make quite a difference.
The IPCC’s report takes these new approaches on board and expands the 1.5C budget, pushing it out to 420GtCO2 – equivalent to around 10 years of current emissions.
In a separate analysis piece published today, Carbon Brief has delved into the detail of this new, larger carbon budget and expanded on the reasons behind the shift.
Despite the change, it is worth noting that the key message remains the same: global CO2 emissions need to fall to net-zero by mid-century to avoid 1.5C of warming.
And even with the revised 1.5C carbon budget, it is unlikely to be the end of the debate. There are still a number of large uncertainties remaining, such as how to account for non-CO2 factors, what observational temperature datasets should be used, and whether Earth-system feedbacks, such as melting permafrost, are taken into account.
What role will ‘negative emissions’ play in limiting warming to 1.5C?
The report acknowledges that limiting warming to 1.5C will require the use of “negative emissions technologies” (NETs) – methods that remove CO2 from the atmosphere. In the report, these techniques are referred to as “carbon dioxide removal” (CDR).
To limit global temperature rise to 1.5C without overshoot, some use of NETs will be needed, the SPM notes:
“All pathways that limit global warming to 1.5C with limited or no overshoot project the use of CDR on the order of 100-1,000GtCO2 [billion tonnes] over the 21st century.”
And, if global temperatures do overshoot 1.5C, large-scale use of NETs will be required in order to bring warming back down, Prof Piers Forster told a press briefing:
“I think one of the most of the important things in the terms of this 1.5C report are these high overshooting scenarios where temperatures go above 1.7C and then return to below 1.5C by the end of the century. These scenarios will only be possible if we hugely invest in, scale up and build the technology for CO2 removal.”
It is worth noting that the SPM appears to underestimate the degree to which NETs could be needed in order to limit warming to 1.5C in comparison to the full report, says Dr Oliver Geden, head of the research at the German Institute for International and Security Affairs, who was not a report author. He tells Carbon Brief:
“The SPM states that conventional mitigation is not enough and that there’s an additional need for CDR. Compared to the full report, the SPM paints too rosy a picture on this. The SPM talks about 100-1,000GtCO2 removal by 2100. But the report itself shows a mean CDR value much closer to the upper end of the 100-1,000GtCO2 range.”
The amount of CO2 that will need to be removed using NETs depends on how quickly and effectively cuts are made to global greenhouse gas emissions, the report says.
Even with rapid mitigation efforts, it is likely that NETs will be required to offset emissions from sectors that cannot easily reduce their emissions to zero, researchshows. These sectors include rice and meat production, which produce methane, and air travel.
The degree to which NETs will be needed matters because each of them come with “economic and institutional barriers” – as well as possible impacts on people and wildlife, Prof Heleen de Coninck, a researcher in climate change mitigation and policy from Radboud University in the Netherlands and coordinating lead author of chapter four of the report, told a press briefing.
For instance, several of the NETs would require the world to drastically change the way it uses the land. This includes bioenergy with carbon capture and storage (BECCS) and afforestation.
BECCS involves growing crops, burning them to produce energy, capturing the CO2 that is released during the process and storing it in an underground site. Afforestation, meanwhile, involves turning barren land into forest. Because plants absorb CO2 as they grow, both techniques would effectively remove CO2 from the atmosphere.
However, if these techniques were deployed at scale, they could compete for land with food production and natural habitats, the SPM says:
“Afforestation and bioenergy may compete with other land uses and may have significant impacts on agricultural and food systems, biodiversity and other ecosystem functions and services.”
The charts below show four possible pathways for reaching 1.5C. On the charts, grey shows fossil fuel emissions, while yellow and brown show the emissions reductions achieved by BECCS, and agriculture, forestry and other land use (AFOLU), respectively.
(Note that AFOLU also includes emissions reductions from other land-based NETS, such as natural forest regeneration and soil carbon sequestration.)
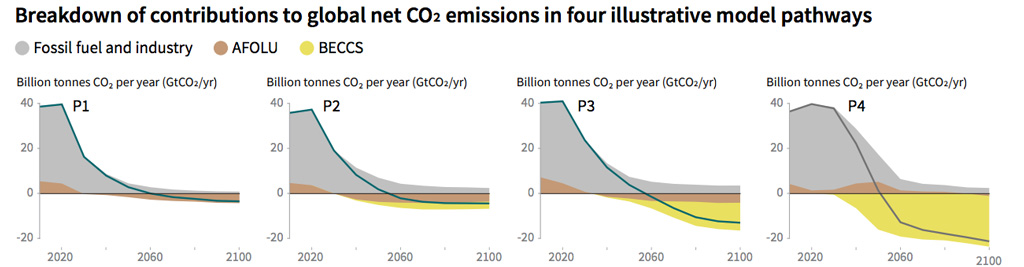
Four illustrative scenarios for limiting temperature rise to 1.5C above pre-industrial levels. Grey shows fossil fuel emissions, while yellow and brown show the emissions reductions achieved by BECCS, and agriculture, forestry and other land use (AFOLU), respectively. Source: Summary for Policymakers, IPCC
The P1 pathway assumes that the world rapidly reduces its fossil fuel emissions after 2020. This is largely achieved by reducing the global demand for energy, chiefly by switching to more energy-efficient technologies and behaviours. This pathway requires a relatively small amount of negative emissions, which is expected to be achieved via afforestation.
The P2 pathway also sees the world switch towards sustainable and healthy consumption patterns, low-carbon technology innovation, and well-managed land systems – this time with a limited amount of BECCS.
The P3 pathway is a “middle-of-the-road scenario” in which historical social and economic trends continue. Emissions reductions are mainly achieved by changing the way in which energy is produced and to a lesser degree by reductions in demand. This scenario requires a relatively large amount of BECCS.
The P4 pathway is a “resource and energy-intensive scenario”, which sees a growth in demand for high-energy products, such as air travel and meat. Emissions reductions are mainly achieved through BECCS.
(Pathways 1-3 see little-to-no overshoot of the 1.5C target, whereas P4 expects a high chance of overshoot.)
The chart below – which is taken from page 46 of chapter two (pdf) of the main report – shows the expected land-use change in 2050 and 2100 under each scenario. It is important to note that, on this chart, P1, P2, P3 and P4, correspond with “LED”, “S1”, “S2” and “S5”, respectively.
On the chart, expected land-use change for food crops (pink), energy crops (orange), forest (turquoise), “natural” land (blue) and pasture (green) are shown. Any number below zero indicates an overall decrease, while any number above shows expected increase.
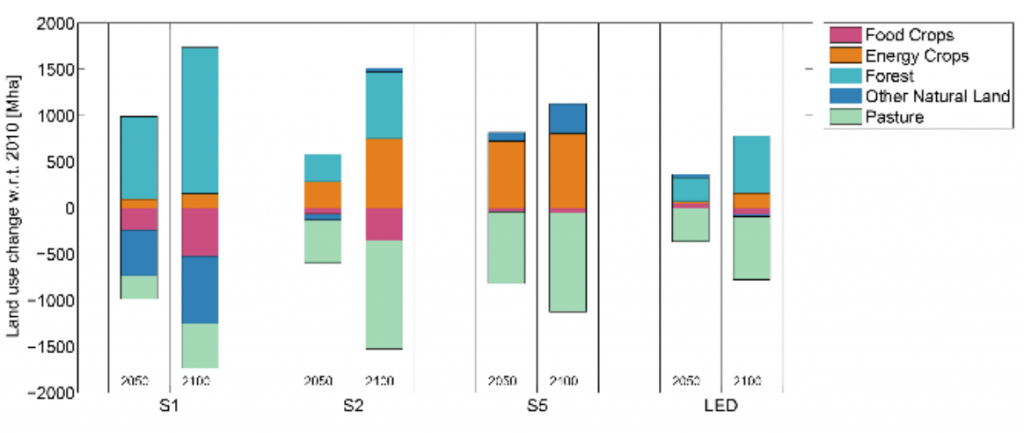
Expected land-use change (million hectares) under four illustrative scenarios for limiting global warming to 1.5C above pre-industrial levels. Land-use change for food crops (pink), energy crops (orange), forest (turquoise), “natural” land (blue) and pasture (green) are shown. Source: IPCC
The chart indicates how that, even in the scenario assuming the lowest possible reliance on negative emissions (P1/LED), land-use change is still expected to be substantial. Under P1/LED, it is assumed that 500m hectares of land – an area that is roughly twice the size of Argentina – is converted to forest by 2100. The pathway expects a similar-sized reduction in pastureland.
The P2/S1 pathway, which sees only limited use of BECCS, also expects large areas of land to be converted to forests, the report authors note on page 45:
“In pathways that allow for large-scale afforestation in addition to BECCS, land demand for afforestation can be larger than for BECCS. This follows from the assumption in the modelled pathways that, unlike bioenergy crops, forests are not harvested to allow unabated carbon storage on the same patch of land.”
However, in addition to the possible impacts of each of the NETs, the researchers also had to consider their overall level of “maturity” – or feasibility, Prof Jim Skea, co-chair of working group III (WG3) and chair of sustainable energy at Imperial College London, told a press briefing:
“Some of the nature-based techniques are definitely mature in the sense that we are doing them now and they are ready – it’s a question of the scale and the incentives that are needed for seeing them through.”
These “nature-based techniques”, which are also known as “natural climate solutions”, include afforestation, natural habitat regeneration and enhancing soil carbon stocks.
In comparison, BECCS should be considered less mature than nature-based methods, Skea says. This is because, although carbon capture and storage (CCS) has been demonstrated on a small scale at several sites across the world, it has not been shown to work alongside bioenergy at scale. “We’ve never really combined them together,” he says:
“Some of the other methods are lot more conceptual – for example, the enhanced weatheringof rock. Scientists believe it could be done. That’s what’s meant by the different levels of maturity. Some are ready to go now – they just need more incentives, others need a bit more development work.”
Could ‘solar geoengineering’ play a role in meeting 1.5C?
Solar geoengineering is only mentioned once in the SPM and 11 times in chapter four(pdf) of the report, where it is referred to as “solar radiation modification” (SRM).
SRM refers to a group of untested technologies that could, theoretically, reduce global warming by increasing the amount of sunlight that is reflected away from the Earth.
The report lists four of what it calls the “most-studied” options for SRM: stratospheric aerosol injection, marine cloud brightening, cirrus-cloud thinning and high-albedo crops and buildings. (More information on how these methods would work is detailed in Carbon Brief’s explainer on SRM.)
A lack of available scientific research led the authors to focus on just one of the proposed options, Prof Heleen de Coninck told the press briefing:
“The type of SRM we looked at was mainly stratospheric aerosol injection because that is what most of the literature is about. There’s been no experiments done so there’s no experimental evidence to assess – that’s why we’re saying it can only theoretically be effective in reducing the temperature.”
In accordance with the available scientific research, the report only considers “SRM as a supplement to deep mitigation, for example, in overshoot scenarios,” the authors say. The SPM reads:
“Although some SRM measures may be theoretically effective in reducing an overshoot, they face large uncertainties and knowledge gaps as well as substantial risks, institutional and social constraints to deployment related to governance, ethics, and impacts on sustainable development. They also do not mitigate ocean acidification.”
One ethical concern is a possible “moral hazard effect”, de Coninck says, which is the idea that research and development into solar geoengineering could deter policymakers from pursuing stringent mitigation.
Another risk mentioned in the report is “termination shock”. This is the fear that, if solar geoengineering was deployed and then suddenly stopped – as a result of political disagreement or a terrorist attack, for example – global temperatures could rapidly rebound.
This sharp temperature change could be “catastrophic” for wildlife, studies have suggested. However, other research argues that the likelihood of a termination shock has been “overplayed” and that measures could be put in place to ensure that the risk is minimised.
Many of the risks posed by SRM have not yet been adequately assessed by scientific research, de Coninck says:
“We’re not saying it’s not viable – that would be going beyond the IPCC’s mandate – but we’re noting that…it’s still a very developing field.”
What are the costs and benefits of meeting the 1.5C limit?
One obvious question about the 1.5C limit is whether it is worth meeting. In other words, do the benefits of avoided climate damages due to flooding, for example, outweigh the cumulative costs of cutting emissions?
Unfortunately, SR15 explicitly does not look at the total cost of 1.5C pathways. This is because the scientific literature on the subject is “limited”. Instead, the report looks at the global average “marginal abatement costs” this century. In other words, the costs per tonne of avoided emissions.
These marginal abatement costs are sometimes ambiguously referred to as the price of carbon used in IAM model pathways. This is not the same as a target or “required” carbon price in the real world, not least because IAMs often use a carbon price as a proxy for all other climate policy. Chapter two explains:
“A price on carbon can be imposed directly by carbon pricing or implicitly by regulatory policies. Other policy instruments, like technology policies or performance standards, can complement carbon pricing in specific areas.”
Nevertheless, the evidence suggests that carbon pricing should increase in order to meet more stringent climate goals, says chapter two.
In general, the SPM says that marginal abatement costs are roughly three to four times higher in 1.5C pathways, compared to 2C. It also sets out estimated investment needs for 1.5C pathways:
“Total annual average energy-related mitigation investment for the period 2015 to 2050 in pathways limiting warming to 1.5C is estimated to be around $900bn…Annual investment in low-carbon energy technologies and energy efficiency are upscaled by roughly a factor of five by 2050 compared to 2015.”
The SPM adds that “knowledge gaps” make it difficult to compare these mitigation costs against the benefits of avoided warming. For example, adaptation costs at 1.5C “might” be lower than for 2C, the SPM says, though it adds that costs are “difficult to quantify and compare”. Chapter two says:
“Pathways that are consistent with sustainable development show fewer mitigation and adaptation challenges and are associated with lower mitigation costs.”
Notably, however, while IAM pathways set out the costs of limiting warming to 1.5C, they do not generally consider the benefits of doing so, says the technical annex (pdf) to chapter two.
Meanwhile, these potential avoided climate damages from limiting warming to 1.5C are highly uncertain, as chapter three (pdf) of the report explains:
“Balancing of the costs and benefits of mitigation is challenging because estimating the value of climate change damages depends on multiple parameters whose appropriate values have been debated for decades (for example, the appropriate value of the discount rate) or that are very difficult to quantify (for example,the value of non-market impacts; the economic effects of losses in ecosystem services; and the potential for adaptation, which is dependent on the rate and timing of climate change and on the socioeconomic content).”
The best estimate of cumulative discounted damages due to 1.5C of warming by 2100 amounts to $54tn, the report says, rising to $69tn for 2C.
Will the world be able to adapt to 1.5C and beyond?
The report finds that, in general, the need for adaptation to climate change will be lower at 1.5C than 2C. However, it warns that, even if global warming is limited to 1.5C, it will not be possible to prepare for all of the impacts of climate change.
The report describes human adaptation to climate change as “the process of adjustment to actual or expected climate and its effects, in order to moderate harm or exploit beneficial opportunities”.
There are a number measures that could be taken to limit the impact of climate change on humans, the report says.
The table below – taken from pages 38-9 of chapter four (pdf) of the report – details eight “overarching” options for adaptation. The first column lists the conditions needed for the options to work and the second offers examples of where the options have already been implemented.
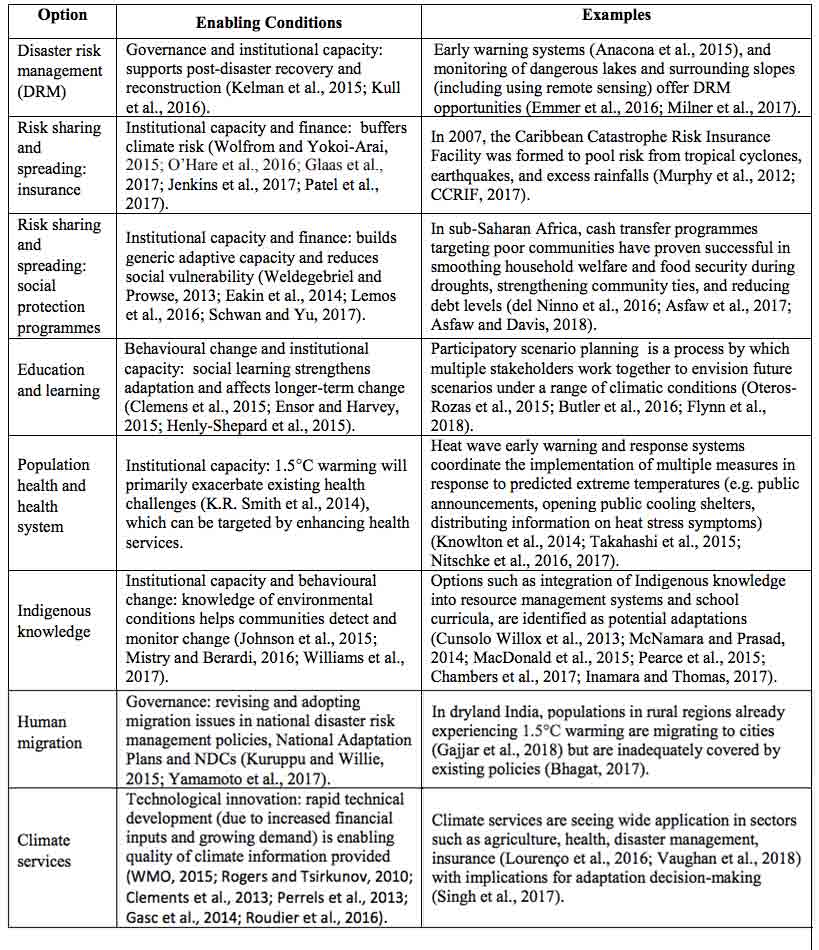
Eight “overarching” options for adapting for climate change. The first column lists the conditions needed for the options to work and second offers examples of where the options have already been implemented. Source: IPCC
The first option, disaster risk management, is defined by the authors as “a process for designing, implementing and evaluating strategies, policies and measures to improve the understanding of disaster risk, and promoting improvement in disaster preparedness, response and recovery”.
As temperatures continue to rise, there is likely to be an “increased demand to integrate DRM and adaptation”, the authors write, “to reduce vulnerability, but institutional, technical and financial capacity challenges in frontline agencies constitute constraints”.
Another adaptation option discussed in the table is migration. The report notes that, at present, there is “low agreement as to whether migration is adaptive, in relation to cost effectiveness”. It says:
“Migrating can have mixed outcomes on reducing socio-economic vulnerability and its feasibility is constrained by low political and legal acceptability, and inadequate institutional capacity.”
In contrast to the report, migration is not listed as an adaptation option in the SPM.
The last adaptation option, “climate services”, refers to the possible dissemination of relevant climate information via daily forecasts and weather advisories, as well as seasonal forecasts and even multi-decadal projections. These kinds of services are already being used in sectors such as agriculture, health, disaster management, the report notes.
A number of steps could also be taken to reduce the risks facing natural ecosystems, the report says. These include restoring degraded natural spaces, strengthening actions to halt deforestation and pursuing sustainable agriculture and aquaculture.
The total costs associated with adapting to global warming of 1.5C are “difficult to quantify and compare with 2C,” says the SPM. This is largely to gaps in the scientific literature, the report authors say.
The SPM notes that adaptation has, typically, been funded by public sector sources, such as national governments, channels associated with the UN and through multilateral climate funds.
What are the links between 1.5C and poverty?
The final chapter of the report (chapter five, pdf) is dedicated to examining how climate change could impact sustainable development, poverty and inequality.
The SPM notes that, across the world, poorer communities are likely to be impacted disproportionately by global warming of 1.5C or higher.
“Populations at disproportionately higher risk of adverse consequences of global warming of 1.5C and beyond include disadvantaged and vulnerable populations, some indigenous peoples, and local communities dependent on agricultural or coastal livelihoods.”
A large proportion of the world’s poor rely on subsistence farming and so will be directly affected by the impact of climate change on temperature, rainfall and drought, says Prof Chuks Okereke, lead author of chapter five from the department of geography and environmental science at the University of Reading. He told a press briefing:
“A key finding of the report is these efforts to limit global warming to 1.5C can actually go hand in hand with many other intended to address issues of inequality and poverty eradication.”
In fact, limiting temperature rise to 1.5C rather than 2C could save “several hundred million” people from facing poverty by 2050, according to the report.
In addition, limiting global warming could also help the world to achieve many of the UN sustainable development goals (SDGs), the report says. The 17 SDGs are a set of targets, agreed in 2015, that aim to “end poverty, protect the planet and ensure that all people enjoy peace and prosperity” by 2030, according to the UN Development Programme.
It is worth noting, however, that, in some cases, actions to limit warming to 1.5C could come with trade-offs with the SDGs, the SPM notes:
“Mitigation options consistent with 1.5C pathways are associated with multiple synergies and trade-offs across the SDGs. While the total number of possible synergies exceeds the number of trade-offs, their net effect will depend on the pace and magnitude of changes, the composition of the mitigation portfolio and the management of the transition.”
The chart below summarises the potential positive (synergies) and negative (trade-offs) effects of mitigation options for reaching 1.5C on each of the SDGs. On the chart, the total length of the bars represent the size of the positive or negative effect, while shading shows the level of confidence (light to dark: low to very high).
The mitigation techniques are split into three sectors: energy supply, energy demand and land. Options assessed in the energy supply sector include biomass and renewables, nuclear, BECCS, and CCS with fossil fuels. The energy demand sector comprises options for improving energy efficiency in the transport and building sectors. The land sector comprises afforestation and reduced deforestation, sustainable agriculture, low-meat diets and a reduction in food waste, and soil carbon management.
You can read the Q&A in its entirety here.
What’s next?
In the short term, the report will be used immediately by the people who first requested it nearly three years ago in Paris – the world’s governments.
Climate negotiators from almost 200 countries are due to meet in Poland in December at the next annual round of talks. The IPCC report is certain to be cited and quoted by negotiators from a variety of countries as they, among other things, try to agree on the “rulebook” for the Paris Agreement.
The IPCC itself will now turn its attention to two more special reports before it publishes its sixth assessment report (pdf) in 2021. In September 2019, at a meeting in Kenya, it is due to finalise a special report on the “ocean and cryosphere in a changing climate”. At the same time, it will also finalise a special report on “climate change and land”.
In the UK, the government said earlier this year that, once the IPCC report is out, it will ask its official advisory body, the Committee on Climate Change, to assess the “implications” of revising the Climate Change Act 2008 to better reflect the Paris Agreement’s goals.
The Climate Change Act legally commits the UK to reduce its greenhouse gas emissions by “at least” 80% by 2050 against 1990 levels. Claire Perry, the minister for energy and clean growth, has said on a number of occasions since that announcement in April that governments need to “raise ambition to avert catastrophic climate change”.
As Carbon Brief explained at the time, the CCC has already said that a global 1.5C limit would mean a more ambitious 2050 goal for the UK, in the range of 86-96% below 1990 levels, as well as setting a net-zero target at some point.