America’s Great Climate Exodus Is Starting in the Florida Keys

By Prashant Gopal
View the original article here.

Mass migration begins as coastal homes are bulldozed in the state facing the biggest threat from climate-driven inundation.

Lori Rittel’s home in Marathon Keys, on Sept. 16

Lori Rittel’s home in Marathon Keys, on Sept. 16

Lori Rittel is stuck in her Florida Keys home, living in the wreckage left by Hurricane Irma two years ago, unable to rebuild or repair. Now her best hope for escape is to sell the little white bungalow to the government to knock down.

Her bedroom is still a no-go zone so she sleeps in the living room with her cat and three dogs. She just installed a sink in the bathroom, which is missing a wall, so she can wash her dishes inside the house now. Weather reports make her nervous. “I just want to sell this piece of junk and get the hell out,” she said. “I don’t want to start over. But this will happen again.”

Lori Rittel

Lori Rittel

The Great Climate Retreat is beginning with tiny steps, like taxpayer buyouts for homeowners in flood-prone areas from Staten Island, New York, to Houston and New Orleans — and now Rittel’s Marathon Key. Florida, the state with the most people and real estate at risk, is just starting to buy homes, wrecked or not, and bulldoze them to clear a path for swelling seas before whole neighborhoods get wiped off the map.

By the end of the century, 13 million Americans will need to move just because of rising sea levels, at a cost of $1 million each, according to Florida State University demographer Mathew Haeur, who studies climate migration. Even in a “managed retreat,” coordinated and funded at the federal level, the economic disruption could resemble the housing crash of 2008.

The U.S. government’s philosophy has been that local officials are in the best position to decide what needs to be done. Consequently, the effort has so far been ad hoc, with local and state governments using federal grants from the last disaster to pay for buyouts designed to reduce the damage from the next one.

“The scale of this is almost unfathomable,” said Billy Fleming, a landscape architecture professor at the University of Pennsylvania. “If we take any of the climate science seriously, we’re down to the last 10 to 12 years to mobilize the full force of the government and move on managed retreat. If we don’t, it won’t matter, because much of America will be underwater or on fire.”

If not for the $174,000 that Rittel, 60, owes on her mortgage, the Montana transplant would have left long ago. Insurance money is insufficient to rebuild, so she applied for one of the buyouts, administered by the state with $75 million of Irma-relief cash from the U.S. Department of Housing and Urban Development, as long as it lasts.

The inside of Lori Rittel’s home. Photographer: Jayme Gershen/Bloomberg

The inside of Lori Rittel’s home.
Photographer: Jayme Gershen/Bloomberg

Florida accounts for 40% of the riskiest coastal land in the U.S., according to the Union of Concerned Scientists, but it’s done little so far to pull people back from the coasts and lags behind states such as New Jersey, North Carolina and Texas. Across the country, the effort is still more theory than practice, even as a consensus among planners grows that “managed retreat” may be the best of bad options.

This year, HUD made available $16 billion for climate resilience, its first dedicated fund to fortify for future storms. Nine states, plus Puerto Rico and the Virgin Islands, will decide how to use it, whether to build sea walls, put houses on stilts or move people out of the way. The money is a fraction of what’s needed, and the process is moving at the speed of government.

A study by the Natural Resources Defense Council this month found that buyouts by the Federal Emergency Management Agency, which responds to disasters, take five years on average to be completed. By that time, many homeowners have rebuilt or moved. Similar data isn’t available on the grants from HUD, which also provides money to demolish homes.

“It’s a slow-motion emergency,” said Rob Moore, director of NRDC’s water and climate team. “But it’s happening right now. These last three hurricane seasons show us what it kind of looks like.”

A FEMA spokesman said the agency supports the  voluntary acquisition of flood-prone structures and provides the grant funding, but the prioritization of projects happens at the local level first and then by the state acting as the recipient. The agency believes each county floodplain manager and local official knows the needs of their communities best and are responsible for land usage and permitting.

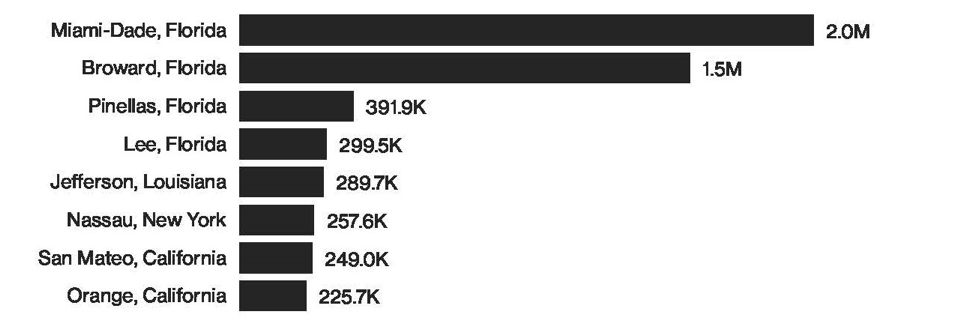
About 6 million Floridians will need to move inland by century’s end to avoid inundation, according to Hauer, the demographer, in a 2016 paper. By then, about 80% of the nearby Keys, the archipelago that includes the tourist mecca of Key West, will be underwater. About 3.5 million people would be flooded in South Florida’s Miami-Dade and Broward, the two counties with America’s biggest exposed populations.

“Florida’s doing it at a really small scale,” said A.R. Siders, an assistant professor at the University of Delaware who studies climate adaptation. “Compared with the new housing units going up in South Florida, I don’t know if that would even cancel out.”

Here Comes the Flood

Number of people at risk by county from a sea level rise of 1.8 meters

Florida State University demographer Matt Hauer

Florida State University demographer Matt Hauer

But Florida runs on tourism and real estate revenue, and managed retreat is a phrase that makes real estate listing agents nervous. But there’s another Florida housing bubble waiting to pop. The Union of Concerned Scientists warns of a coming housing crash — from Miami to San Mateo, California — on a scale worse than last decade’s foreclosure crisis, caused by climate change — from flooding to heat waves and wildfires.

Cities are only starting to grapple with where to resettle residents, and how to transport communities and hometown identities. And homes on higher ground will also demand higher prices, worsening an affordability crisis.

Fifteen years after Hurricane Katrina, Louisiana is trying to relocate the Native American settlement of about 100 people on the Isle de Jean Charles, a narrow island that lost 98% of its land over the past six decades to climate change. It’s working with a $48 million grant from HUD for buyouts and to help them start anew on a 500-acre sugar cane field 40 miles north that the government will populate with homes and businesses. Importantly, it will be 9 feet above sea level. All but three of about 40 households have signed on.

“They’re starting to scale this up,’’ said Jesse Keenan, a social scientist at Harvard University who also specializes in climate adaptation. “This is about building up institutional knowledge on how to do this.’’

​​​​​​​New Jersey has a $300 million fund for buyouts and has purchased hundreds of houses since Superstorm Sandy in 2012, though like Florida, even more homes have been built on the coast in the meantime. Harris County, Texas — which includes Houston, ravaged by a series of storms including 2017’s Harvey — has done more than 3,000 FEMA buyouts, more than any other county in the U.S., according to NRDC.

In Monroe County, Florida, where Rittel lives, the planning is just beginning. The county has applied for $5 million of the HUD money — the state maximum. Already, about 60 local homeowners have applied, so it will require triage. Senior citizens, families and residents in the riskiest flood zone would get priority, said Assistant County Administrator Christine Hurley.

Rittel isn’t sure how long she can hang on.

Her insurance payout of about $100,000 would cover repairs to the 640-square-foot house. But the county requires that when more than 50% of a home is damaged, that it be completely rebuilt to meet modern storm-resiliency codes and — in her flood zone — on stilts. That would cost at least $200,000, money she doesn’t have.

She dreams of resettling in Key West or Homestead, a safer spot on the Florida mainland.

“I’d like to take the money and run,” Rittel said. “But I’ll have to buy something on stilts. I’m not buying anything on the ground down here ever ever again.”

This story is part of Covering Climate Now, a global collaboration of more than 220 news outlets to highlight climate change.


Utilities are starting to invest in big batteries instead of building new power plants

By Jeremiah Johnson and Joseph F. Decarolis
View the original article here.

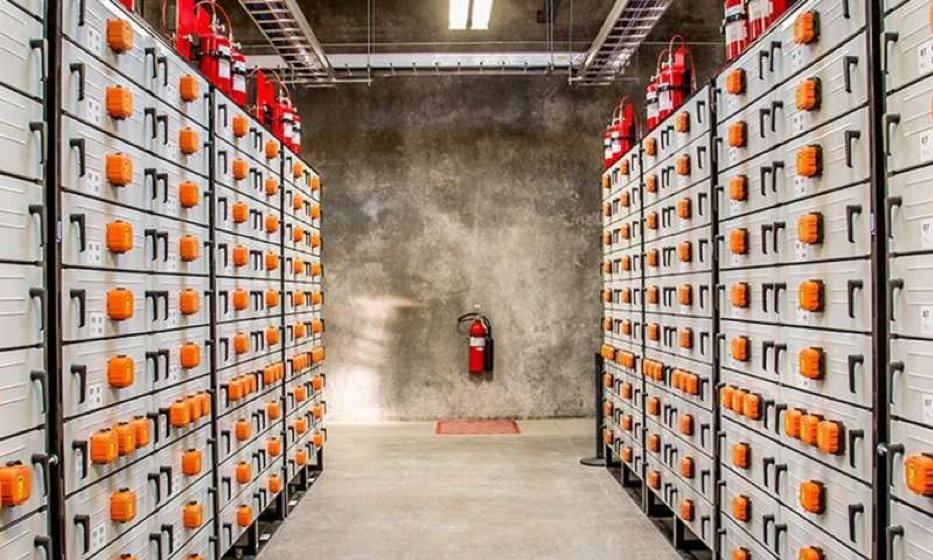
This is what a 5-megawatt, lithium-ion energy storage system looks like. Credit: Pacific Northwest National Laboratory

This is what a 5-megawatt, lithium-ion energy storage system looks like. Credit: Pacific Northwest National Laboratory

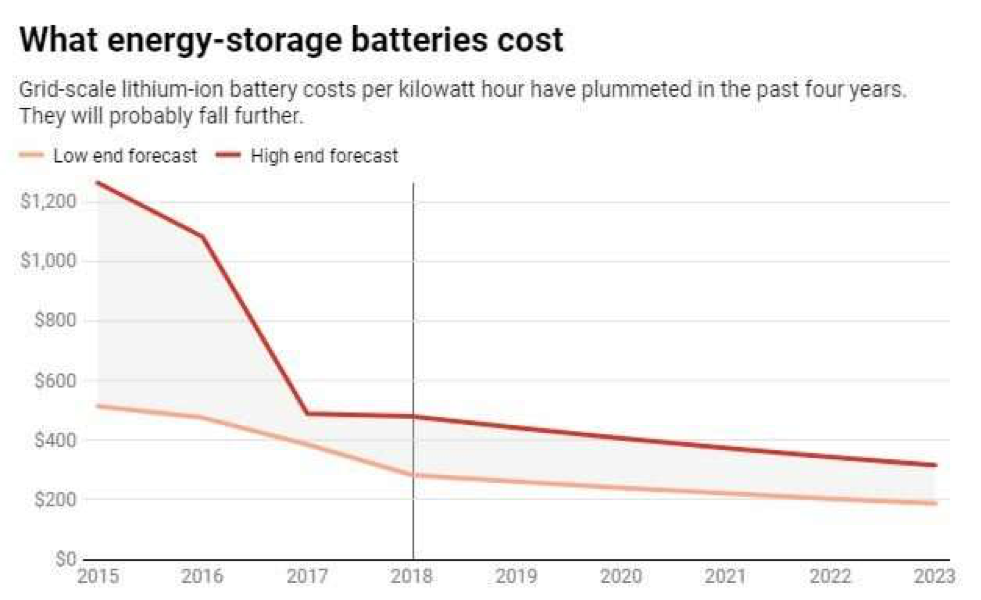
Due to their decreasing costs, lithium-ion batteries now dominate a range of applications including electric vehicles, computers and consumer electronics.

You might only think about energy storagewhen your laptop or cellphone are running out of juice, but utilities can plug bigger versions into the electric grid. And thanks to rapidly declining lithium-ion battery prices, using energy storage to stretch electricity generation capacity.

Based on our research on energy storage costs and performance in North Carolina, and our analysis of the potential role energy storage could play within the coming years, we believe that utilities should prepare for the advent of cheap grid-scale batteries and develop flexible, long-term plans that will save consumers money.

Peak demand is pricey

The amount of electricity consumers use varies according to the time of day and between weekdays and weekends, as well as seasonally and annually as everyone goes about their business.

Those variations can be huge.

For example, the times when consumers use the most electricity in many regions is nearly double the average amount of power they typically consume. Utilities often meet peak demand by building power plants that run on natural gas, due to their lower construction costs and ability to operate when they are needed.

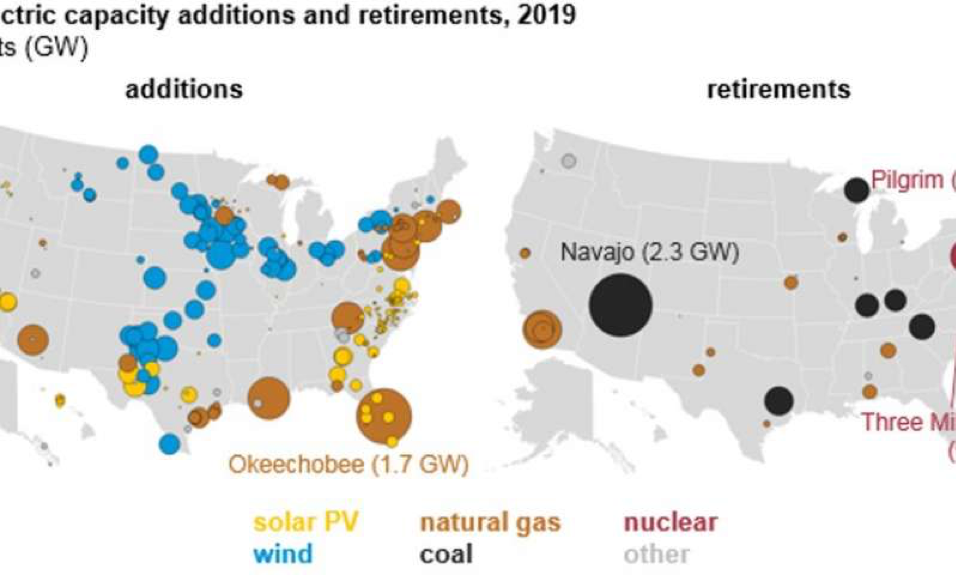
All of the new utility-scale electricity capacity coming online in the U.S. in 2019 will be generated through natural gas, wind and solar power as coal, nuclear and some gas plants close. Credit: U.S. Energy Information Administration

All of the new utility-scale electricity capacity coming online in the U.S. in 2019 will be generated through natural gas, wind and solar power as coal, nuclear and some gas plants close. Credit: U.S. Energy Information Administration

However, it’s expensive and inefficient to build these power plants just to meet demand in those peak hours. It’s like purchasing a large van that you will only use for the three days a year when your brother and his three kids visit.

The grid requires power supplied right when it is needed, and usage varies considerably throughout the day. When grid-connected batteries help supply enough electricity to meet demand, utilities don’t have to build as many power plants and transmission lines.

Given how long this infrastructure lasts and how rapidly battery costs are dropping, utilities now face new long-term planning challenges.

Cheaper batteries

About half of the new generation capacity built in the U.S. annually since 2014 has come from solar, wind or other renewable sources. Natural gas plants make up the much of the rest but in the future, that industry may need to compete with energy storage for market share.

In practice, we can see how the pace of natural gas-fired power plant construction might slow down in response to this new alternative.

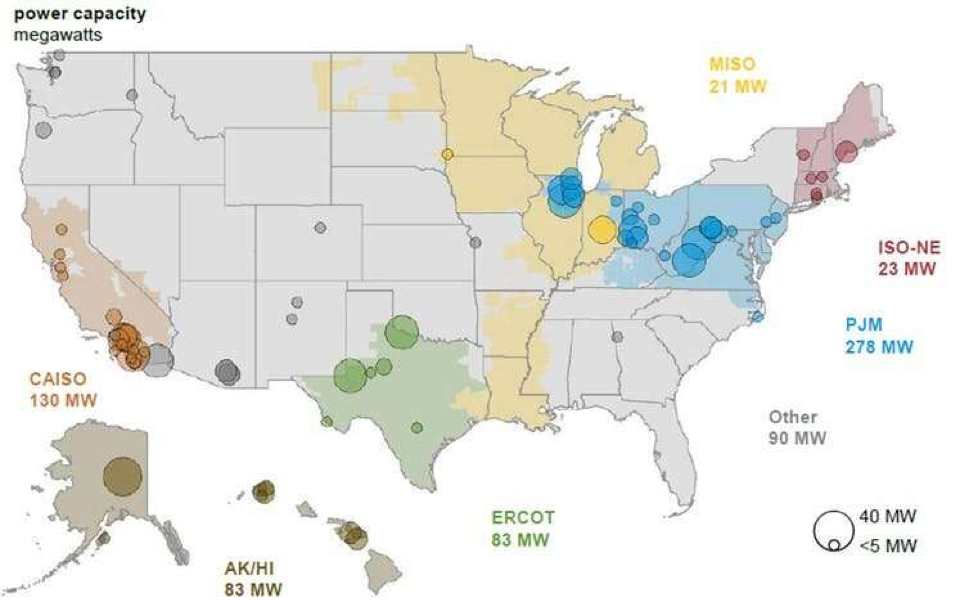
Grid-scale batteries are being installed coast-to-coast as this snapshot from 2017 indicates. Credit: U.S. Energy Information Administration, U.S. Battery Storage Market Trends, 2018.

Grid-scale batteries are being installed coast-to-coast as this snapshot from 2017 indicates. Credit: U.S. Energy Information Administration, U.S. Battery Storage Market Trends, 2018.

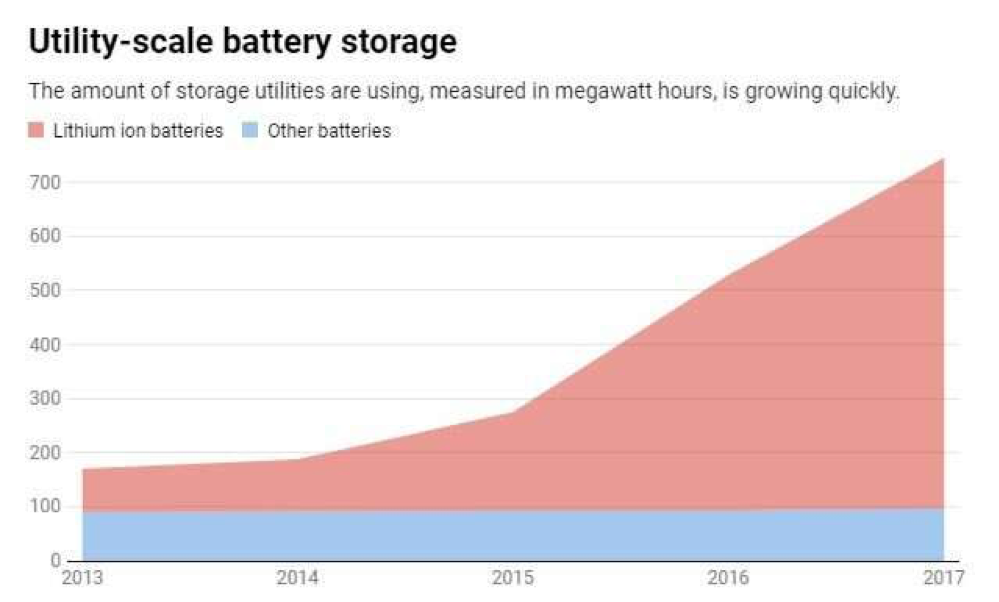
So far, utilities have only installed the equivalent of one or two traditional power plants in grid-scale lithium-ion battery projects, all since 2015. But across California, Texas, the Midwest and New England, these devices are benefiting the overall grid by improving operations and bridging gaps when consumers need more power than usual.

Based on our own experience tracking lithium-ion battery costs, we see the potential for these batteries to be deployed at a far larger scale and disrupt the energy business.

When we were given approximately one year to conduct a study on the benefits and costs of energy storage in North Carolina, keeping up with the pace of technological advances and increasing affordability was a struggle.

Projected battery costs changed so significantly from the beginning to the end of our project that we found ourselves rushing at the end to update our analysis.

Once utilities can easily take advantage of these huge batteries, they will not need as much new power-generation capacity to meet peak demand.

Credit: The Conversation

Credit: The Conversation

Utility planning

Even before batteries could be used for large-scale energy storage, it was hard for utilities to make long-term plans due to uncertainty about what to expect in the future.

For example, most energy experts did not anticipate the dramatic decline in natural gas prices due to the spread of hydraulic fracturing, or fracking, starting about a decade ago – or the incentive that it would provide utilities to phase out coal-fired power plants.

In recent years, solar energy and wind power costs have dropped far faster than expected, also displacing coal – and in some cases natural gas – as a source of energy for electricity generation.

Something we learned during our storage study is illustrative.

We found that lithium ion batteries at 2019 prices were a bit too expensive in North Carolina to compete with natural gas peaker plants – the natural gas plants used occasionally when electricity demand spikes. However, when we modeled projected 2030 battery prices, energy storage proved to be the more cost-effective option.

Credit: The Conversation

Credit: The Conversation

Federal, state and even some local policies are another wild card. For example, Democratic lawmakers have outlined the Green New Deal, an ambitious plan that could rapidly address climate change and income inequality at the same time.

And no matter what happens in Congress, the increasingly frequent bouts of extreme weather hitting the U.S. are also expensive for utilities. Droughts reduce hydropower output and heatwaves make electricity usage spike.

The future

Several utilities are already investing in energy storage.

California utility Pacific Gas & Electric, for example, got permission from regulators to build a massive 567.5 megawatt energy-storage battery system near San Francisco, although the utility’s bankruptcy could complicate the project.

Hawaiian Electric Company is seeking approval for projects that would establish several hundred megawatts of energy storage across the islands. And Arizona Public Service and Puerto Rico Electric Power Authority are looking into storage options as well.

We believe these and other decisions will reverberate for decades to come.If utilities miscalculate and spend billions on power plants it turns out they won’t need instead of investing in energy storage, their customers could pay more than they should to keep the lights through the middle of this century.

The United States is headed for a battery breakthrough

By Tim Sylvia
View the original article here.

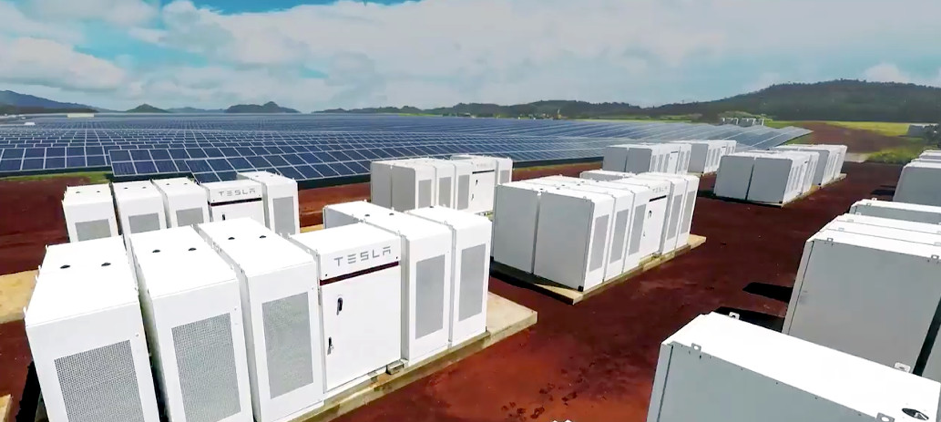
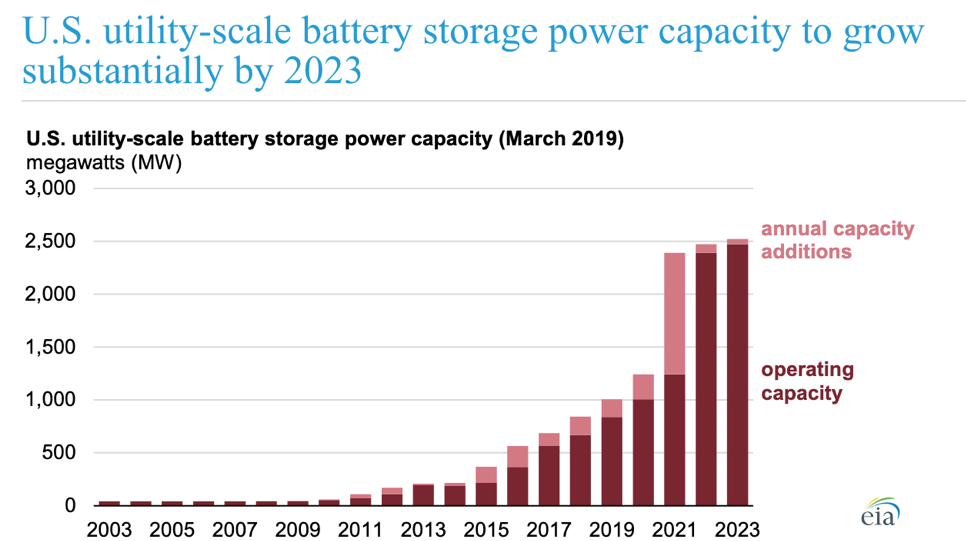
A new report by the Energy Information Administration projects U.S. installed battery storage capacity will reach 2.5 GW by 2023. Florida and New York are set to pave the way as massive projects in each state will account for almost half the coming capacity.

Storage is ready to take off in a big way. Image: Tesla

Storage is ready to take off in a big way. Image: Tesla

Symbiosis is one of life’s most beautiful phenomena. Certain things just work perfectly together and the energy revolution is no different, as renewable energy resources and battery storage go together like peas in a pod.

However, the United States has an operating battery storage capacity of only 899 MW to date. And while that figure is expected to reach 1 GW this year that would still only represent 1/67th of the nation’s cumulative solar generation capacity, and an even smaller percentage of the overall renewables capacity.

That could all be about to change dramatically though, as the U.S. Energy Information Administration(EIA) has released a report predicting battery storage capacity will almost treble by 2023, to 2.5 GW.

Past, current and predicted U.S. battery storage capacity levels. Image: EIA

Past, current and predicted U.S. battery storage capacity levels. Image: EIA


The projections were made based on proposed utility scale battery storage projects scheduled for initial commercial operation within five years. The EIA tracks data with its Preliminary Monthly Electric Generator Inventory survey, which updates the status of projects scheduled to come online within 12 months.

As drastic as a prediction of 2.5 GW appears, there is a precedent. Between late 2014 and March, installed battery storage capacity rose more than four times over, from 214 to 889 MW.

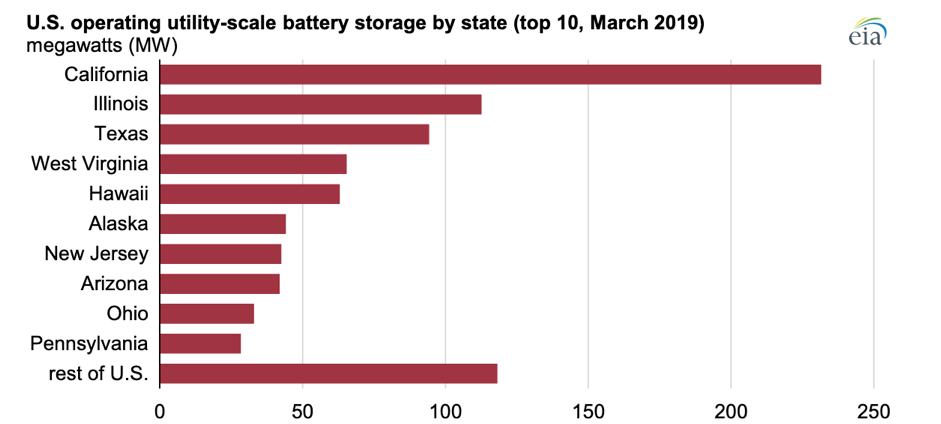
A look at the states that brought the U.S. to its current storage reality offers surprising results. Leading the way was California, unsurprisingly. However, of the six states known to pv magazine to have energy storage mandates, California is the only one in the top 10 for installed capacity. The others: Arizona, Nevada, New York, Massachusetts and Oregon; each have less than 50 MW of installed battery storage capacity.

The top 10 states in terms of current installed battery storage capacity. Image: EIA

The top 10 states in terms of current installed battery storage capacity. Image: EIA

Texas, Illinois and Hawaii are relatively unsurprising storage pioneers as all three states have strong solar industries and Hawaii especially has been pushing battery storage deployment. Right away, however, the names that stand out on the list are West Virginia, Pennsylvania and Ohio. None of those is known as a solar pioneer; they have just under 650 MW of generation capacity installed between them. Special recognition goes to West Virginia on that score, with its 8.5 MW.

So what’s with all the storage? Independent of renewables West Virginia, Pennsylvania and Ohio – plus New Jersey, the seventh state on the list – are all members of the PJM Interconnection. PJM was the first large market for battery storage, and uses the technology for frequency regulation.

That list is likely to look different by 2023, however. Of the 1,623 MW expected to come online by 2024, 725 MW will come courtesy of two projects – both in states outside the current top 10.

Two mammoth projects

The first of those is Florida Power and Light’s (FPL) planned battery system for its Manatee Solar Energy Center in Parrish. The battery is set to clock in at 409 MW, which would make it the largest solar powered battery system in the world.

In that project’s shadow, but nevertheless considerable is the Helix Ravenswood facility, planned in Queens, New York. Almost more impressive than the project’s anticipated 316 MW of capacity is the idea of having a storage project of such magnitude in NYC.

FPL’s Manatee battery is anticipated to begin commercial operation in 2021, as is the first stage of Helix Ravenswood. That initial phase in New York will represent 129 MW of capacity, with the remaining 187 MW following via a 98 MW second phase and 89 MW final stage. The anticipated commercial operation dates of those expansions have not yet been announced.

We have seen the future and there are batteries, lots of them, demonstrating symbiosis extends beyond the natural world.

Emerald Skyline Provides Sustainability and Resiliency Assessments and Risk Ratings for Investors, Lenders, Insurers and Tenants.

“Recognizing the need for sustainability and resiliency due diligence, Emerald Skyline Corporation has developed a Sustainability and Resiliency Assessment (SaRA Rating©) Rating system to provide commercial real estate investors with a complete picture of the risk associated with a particular property or investment.”

BOCA RATON, FL, June 12, 2019

Today, Emerald Skyline introduces its’ Sustainability and Resiliency Assessment (SaRA Rating©) Rating system.   The purpose of the SaRA Rating© Report is to provide information on the sustainability and resiliency of a property given its physical and locational attributes. The property-specific, neighborhood and community together with information on natural and man-made hazards are assessed using Emerald Skyline’s Risk Assessment Rating System to enable investors, buyers, lenders, tenants and other stakeholders, including those who have a security interest in the mortgage, a meaningful gauge on the overall sustainability and resiliency of a property.

SaRA Rating© builds on due diligence information on a property to evaluate a property’s sustainability and resiliency which allows owners, managers and tenants to control and help reduce the rapidly increasing costs of utilities and insurance while reducing the carbon footprint and to understand the property’s resiliency in response to man-made and natural hazards and calamities.

According to MunichRe, an international reinsurance firm, 2018 was the fourth-costliest year for natural disasters in recorded history. The damage and destruction cost $160 billion, of which only half was insured. The worst damage came from Hurricanes Michael and Florence and Asian Typhoons Jebi, Signal 10 Mangkhut and Trami. The California wildfires alone cost $57 billion, of which slightly more than half, $29 billion, was insured.

The damage from natural disasters and extreme weather events– including blizzards, droughts, floods, heat waves, hurricanes, lightning strikes, tornadoes, tsunamis, earthquakes, mudslides, volcanoes and wildfires – cost the US economy a staggering $307 billion in 2017 – more than double the inflation adjusted average of $140 billion.

Of significance to these astounding statistics is the frequency with which natural disasters and extreme weather events are occurring: In 2018 there were 29 events that cost at least $1 billion each in damage while there were 16 events costing more than $1 billion each in 2017. The United Nations has found that the number of natural disasters per year has doubled in the last 20 years.

It no longer makes sense to wait until after a crisis to implement resilience efforts. Resiliency strategies for buildings should be identified and implemented now, so there is a greater chance of improved performance and reduced risk to both people and property, not only today but for the future, benefiting all building stakeholders.

Buildings and businesses do not operate in a vacuum. The evaluation of the sustainability and resiliency of a building is significantly influenced by the neighborhood and community in which it is located. For instance, a building may have hardened exterior skin, wind impact windows and design and equipment protected from flood or wind intrusion, but if the community is nor resilient, the building and its tenants may not be able to recover quickly after a storm. Accordingly, the SaRA Rating© assessment, evaluates both the physical attributes of the subject property and the resiliency of the community in which it is located.

SaRA Ratings

According to Paul Jones, a principal of Emerald Skyline, “armed with the SaRA Rating© and report, the stakeholders can incorporate current and prospective tenant/user demand for the space in the building given the cost of occupancy and resiliency as well as investor demand and potential pricing for the asset. A resilient and sustainable asset will combine low-cost operations due to sustainably-reduced energy and maintenance costs and managed insurance expenses while maximizing the net cash flow and long-term value of the property.”

Emerald Skyline Corporation is a sustainability and resiliency consulting and LEED project management firm formed in 2012 by veteran real estate professionals to facilitate the sustainability and resiliency of the built environment by advising and assisting building owners, managers, tenants and other stakeholders in the evaluation, selection and implementation of sustainable and resilient strategies and practices.

To find out more information about Emerald Skyline’s Sustainability and Resiliency Assessment Rating system, please contact Paul Jones at [email protected] or call him at 786-468-9414

You have checked all the boxes on your due diligence checklist; but have you assessed the Climate Risk of Your Real Property Investment?

By Paul L. Jones, CPA, May 13, 2019

In his legal commentary posted on April 1, 2019, my colleague, Rick Jones, a partner with Dechert LLP, a leading law firm serving the Commercial Real Estate Debt Market, opened with “I’m finally writing about climate change… not because 97 out of 100 scientists are shouting at us incessantly about the need to do something, but because I am dead certain that there are real and fairly immediate risks associated with the public reaction to the perception or awareness (take your pick) of the climate change risk which will drive regulatory intrusion on both the state and federal level, will drive legislation and moreover, will inform market reaction to lenders, investors, developers and their properties because of their climate change posture or profile.”

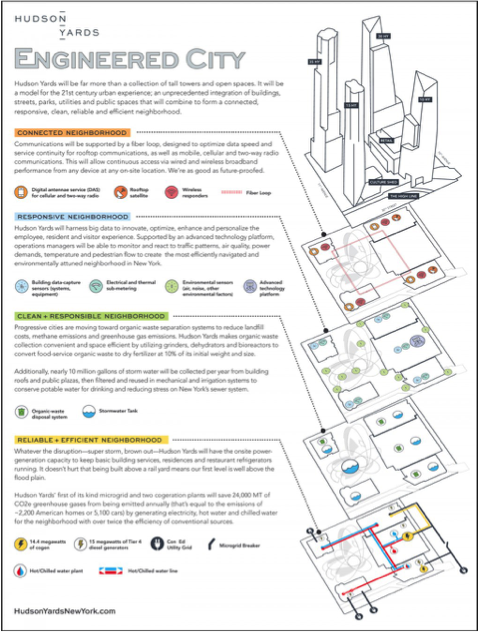
Engineered CItyThe esteemed Mr. Jones continues: “Where do we start?  We are already seeing some commercial real estate owners begin to adapt to regulatory change.  Look at the fantastic engineering marvel which is the Hudson Yards, built 40 feet above sea level, with its storm management system and its fortress-like power system designed to survive a mega storm.  That’s expensive.  It was clearly purpose driven.  We should ask what made them, a bunch of smart folks, put up the money.  I guarantee it wasn’t frivolous.  I would suggest to you that it’s a sign of things to come.  More generally, we are also seeing more solar, more green building technology and more innovations in engineering and in general more willingness to pay real money to address environmental concerns.”

New York has a wet climate, and water – from hurricanes, flooding, storm surges and even blizzards – is one of its primary environmental challenges throughout the year. Of course, buildings in NYC also endure seismic activity, high heat loads in the summer, power outages, manmade disasters like those produced by terrorist attacks as well as high humidity and year-round precipitation.

On the Pacific coast, seismic considerations are a primary concern as well as danger from wildfires, flash floods, and drought.

For most of my career serving the real estate industry, I have primarily conducted due diligence and providing underwriting and financial feasibility analyses for buyers, investors, lenders and capital market participants.

We usually start with a checklist of due diligence and underwriting items which typically includes:

  • reviewing historical operating statements and related reports,
  • abstracting leases and tenant correspondence records,
  • getting a title abstract, checking the flood zone,
  • obtaining and reviewing a property condition assessment (PSA) and a Phase 1 environmental site assessment (ESA), and
  • evaluating all legal and contractual arrangements that may affect the income and expenses of the property.

But, if you are like most real estate investors, you have missed one item which affects all properties and portfolios: the risk resulting from climate change and sea level rise as well as man-made hazards: You still do not know how sustainable and resilient the income and future value from your investment is.

Beginning about five years ago, my clients started to ask questions regarding the potential effect of climate change and sea level rise on the sustainability and resiliency of the property.

  • It is important to note that the risk to real property assets – which are immovable by their nature – exists regardless of whether you believe humans have caused climate change, or not.
  • In fact, my client chose to divest of assets in Miami in order to buy assets in locales without the risk of sea level rise and our screening process involved an informal, yet substantive, assessment of the risk from climate change – no matter the location of the property.

In an article entitled “What does resilience mean for commercial real estate” by Ryan M. Colker published in the September/October issue of BOMA Magazine, he opens with the following observation:

Around the world, the frequency, intensity and impacts of natural disasters are increasing. These events can significantly affect the social, economic and environmental functionality of communities. The ability of commercial buildings and the businesses they house to adequately prepare for such events and quickly return to full operations—a quality known as resilience—contributes significantly to a community’s ability to bounce back. In addition to the community-wide impacts, the state of individual buildings also can affect the long-term viability of the businesses that occupy those buildings.”

For a multi-family, commercial or industrial building, we at Emerald Skyline define building resilience as “the ability of the systems and structure to protect, maintain or restore the value of, functionality of, and income generated by a property after a damaging event or calamity – whether it is from a weather event or a man-made circumstance – within a pre-determined acceptable timeframe.

  • A widely-cited 2005 study by the Multi-hazard Mitigation Council (MMC) of the National Institute of Building Sciences “documented how every $1 spent on mitigation saves society an average of $4.
  • In a 2018 interim update report by the MMC found that costs and benefits of designing all new construction to exceed select provisions in the 2015 IBC and the IRC and the implementation of the 2015 International Wildland-Urban Interface Code (IWUIC) resulted in a national similar benefit of saving $4 in future losses for every $1 spent on additional, up-front construction costs.

In a report published last month (April 2019) by the Urban Land Institute (ULI) and underwritten by Heitman LLC (Heitman) entitled “Climate Risk and Real Estate Decision-making,” the authors note that:

“In 2017, the year Hurricanes Harvey and Maria hit the United States and storms battered northern and central Europe, insurers paid out a record $135 billion globally for damage caused by storms and natural disasters. This figure does not represent actual damages, which in the United States alone equaled $307 billion, according to National Oceanic and Atmospheric Administration estimates.”

In the Foreword, Ed Walter, Global CEO, ULI, and Maury Tognarelli, CEO, Heitman, highlight the need to address sustainability and resiliency:

“Failure to address and mitigate climate risks may result in increased exposure to loss as a result of assets suffering from reduced liquidity and lower income, which will negatively affect investment returns. At the same time, investors who arm themselves with more accurate data on the impact of climate risks could help differentiate themselves and benefit from investing in locations at the forefront of climate mitigation.

And the industry – especially among institutional investors – is taking note. “Many leading investment managers and institutional investors are undertaking flood, resilience, and climate vulnerability scans of their portfolios. These mapping exercises seek to identify the impacts of physical climate risks on their properties, including sea-level rise, flooding, heavy rainfall, water stress, extreme heat, wildfire, and hurricanes. Potential impacts being considered range from physical access and business disruption for tenants to the effects that longer-term temperature increases or increased wear and tear on buildings could have on operating and capital expenditure requirements. The ultimate objective for the investment community is to understand how climate will affect asset liquidity and, as a result, returns, in terms of both income and capital growth.”

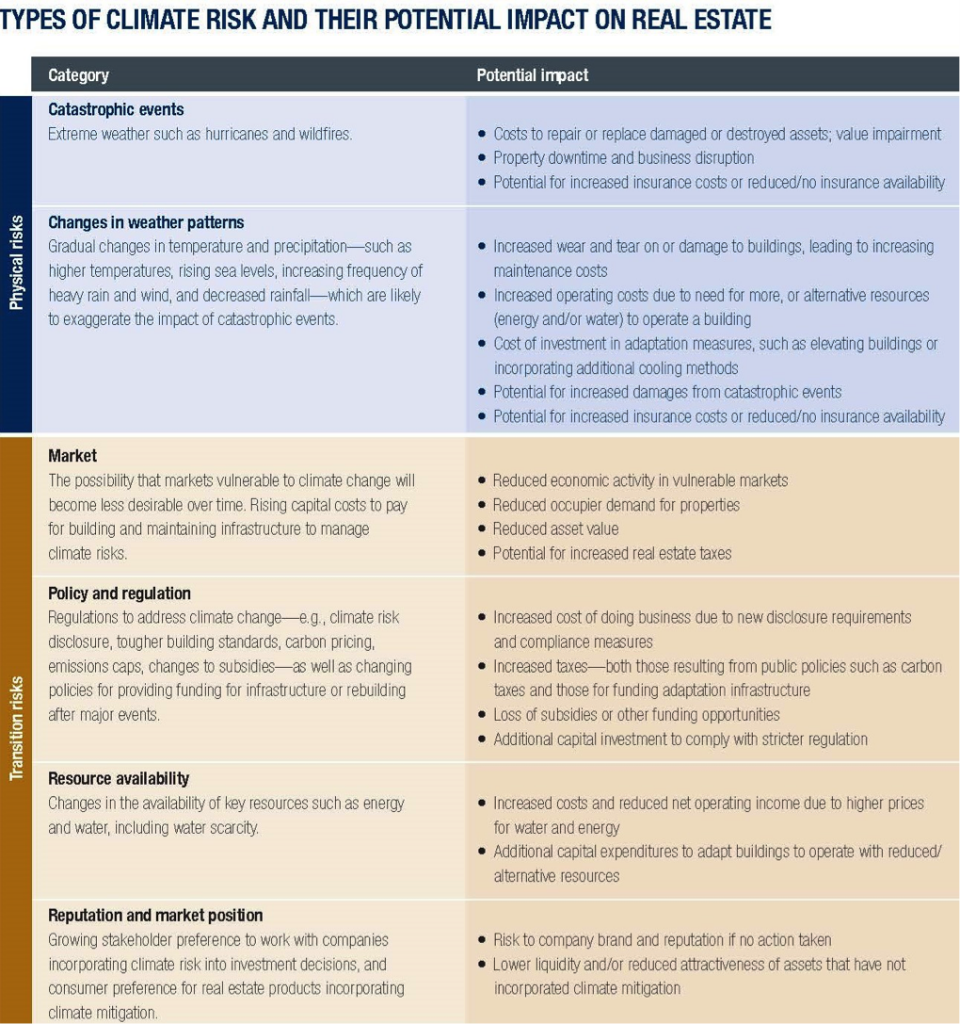
The results of the survey conducted in preparation of this report, the researchers found that industry participants continue to rely on insurance companies to cover potential losses from physical damage due to a natural disaster – but they astutely point out that insurance “does not protect investors from devaluation or a reduction in asset liquidity.” They categorize the climate risks either physical or transitional risks as follows:

  • “Physical risks are those capable of directly affecting buildings; they include extreme weather events, gradual sea-level rise, and changing weather patterns.
  • “Transition risks are those that result from a shift to a lower-carbon economy and using new, non-fossil-fuel sources of energy. These include regulatory changes, economic shifts, and the changing availability and price of resources.

“The location-specific physical threats posed by factors such as sea-level rise, hurricanes, wildfires and forest fires, heat stress, and water stress are among the most easily observable risks to real estate investment. They are a particular concern since many key markets for real estate investment are in areas exposed to the physical impacts of climate change.
These risks and their potential impact on real estate is summarized in the following table.

types of risk

So far, according to the ULI report, “…most investment managers and investors for directly held assets currently use insurance as their primary means of protection against extreme weather and climate events.” However, “leading companies in the industry … are modifying existing decision-making and management processes to add climate and extreme weather-related factors to those being considered alongside other risks and opportunities.

The National Infrastructure Advisory Council (NIAC) in a 2009 repot characterized resilience as having four key features known as the “4-Rs”:

  • Robustness: the ability to maintain critical operations and functions in the face of crisis.
  • Resourcefulness: the ability to skillfully prepare for, respond to and manage a crisis or disruption as it unfolds.
  • Rapid recovery: the ability to return to and/or reconstitute normal operations as quickly and efficiently as possible after a disruption.
  • Redundancy, back-up resources to support the originals in case of failure that should also be considered when planning for resilience

From the Whole Building Design Guide, a program of the National Institute of Building Sciences (NIBS), understanding the relationship between Asset (Building) resilience and the community’s resilience requires an understanding of the distinctions and relationships between risk, resilience and sustainability as follows:

  • Risk is expressed as the relationship between a particular hazard or threat that may degrade, or worse, devastate, the building’s security, operations and functionality and the consequences that result from this degradation of performance.
  • Resilience is the ability of a building or asset to recover from, or adjust, easily to misfortune or change. The ability to prepare and plan for, absorb, recover from, or more successfully adapt to actual or potential adverse effects as reflected in the aforementioned Four Rs.
  • Sustainability of an asset is determined by its ability to meet the needs of the present while being able to maintain its functionality over time without not being harmful to the environment or depleting natural resources.

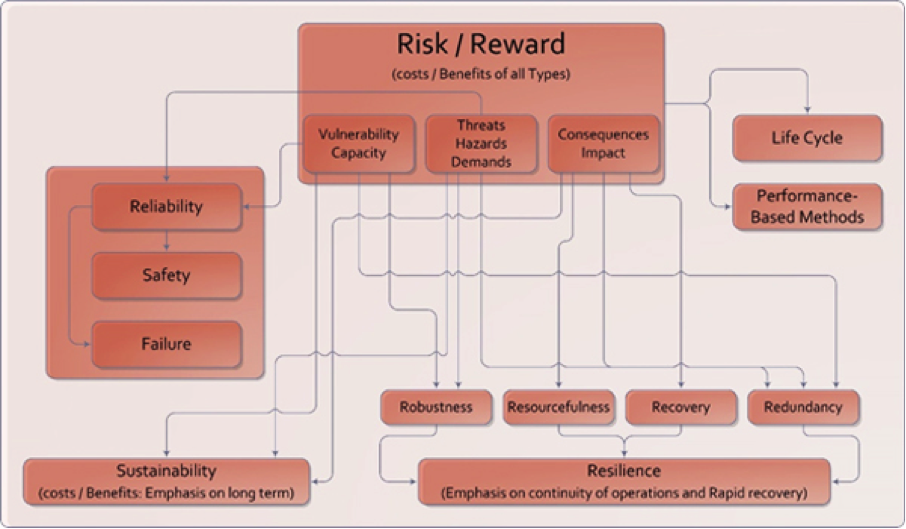
The following diagram created by Mohammed Ettouney and Sreenivas Alampalli in their books on Infrastructure Health in Civil Engineering, presented the relationship of threat, vulnerability and consequences to risk as follows:

riskreward

Recognizing the need for sustainability and resiliency due diligence, Emerald Skyline Corporation has developed a Sustainability and Resiliency Assessment (SaRA Rating©) Rating system to provide commercial real estate investors with a complete picture of the risk associated with a particular property or investment. The information not only helps investors and owners but also provides lenders, insurers and tenants with information relevant to their decisions.

SaRA Rating© incorporates an assessment of the physical attributes of the property – including incorporation of information obtained from traditional due diligence procedures with additional procedures to determine the relative risk, resiliency and sustainability of the property over the investment horizon.

  • The physical review of the property is conducted in conjunction with the Phase I environmental site assessment and the property condition assessment and includes a review of the property’s resiliency features like hardened walls, raised electronic and network connections, secondary systems.

No building operates in a vacuum: Its resiliency, in particular, is directly connected to its location and is directly affected by the surrounding neighborhood, the community, and natural and man-made risks (hazards).

Based on a property-specific assessment including use of mapping services, our team of professionals evaluate a building’s resiliency and sustainability resulting in a rating from 1, not resilient or sustainable (High Risk) to a 5 (Highly Resilient). Our objective is to provide investors with the information they need to make prudent investment decisions that account for the physical, environmental and social risks to the cash flow stream and market value of the building.

At the conclusion of our procedures, we identify land and building improvements that would enhance a property’s resiliency and sustainability. The economics of each improvement or enhancement is assessed in a cost-benefit analysis.

We then evaluate the tradeoffs between performance of a building over its life-cycle and the cost of improving the building systems to ensure its sustainability and resiliency. Accordingly, we evaluate the total cost of ownership (TCO) by determining the capital cost of the property including any improvements plus the present value of the future expenses of operations, maintenance, utilities and the estimated cost to recover from a calamity.

Further, armed with the SaRA Rating© and report, the stakeholders can incorporate current and prospective tenant/user demand for the space in the building given the cost of occupancy and resiliency as well as investor demand and potential pricing for the asset. A resilient and sustainable asset will combine low-cost operations due to sustainably-reduced energy and maintenance costs and managed insurance expenses while maximizing the net cash flow and long-term value of the property.

The objective of all due diligence – including and especially the assessment of all the risks of ownership – is to optimize the overall returns on the investment while quantifying and minimizing the risks and costs to achieve those goals – that is the purpose of Emerald Skyline’s Sustainability and Resiliency Assessment Rating© system – your one-stop resource to measure and manage climate risk in the real estate industry.

For more information, contact Paul L. Jones, CPA, Phone: 786-468-9414; email: [email protected]

Israel Completes World‘s Largest Solar & Thermal Electric Facility

By David Lazarus
View the original article here.

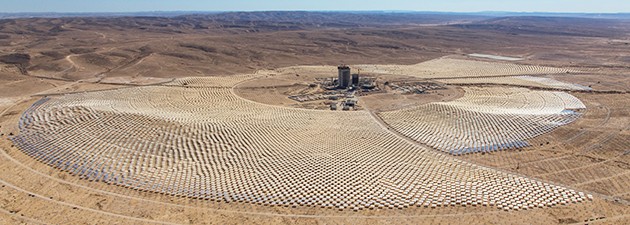
The state-of-the-art thermal electric power plant in Israel’s Negev Desert is equipped with more than 50,000 computer-controlled heliostats that produce enough power for 150,000 homes, keeping 110,000 tons of CO2 emissions out of the air per year.

The Ashalim solar and thermal electric power plant in Israel’s Negev Desert is up and running. The state-of-the-art facility is equipped with more than 50,000 computer-controlled heliostats or mirrors, which can track the sun in two dimensions and reflect the sunlight onto a boiler placed on top of a tower measuring 240 m-high (787.4 ft). That’s higher than some of the tallest sky scrapers in the world and by far the tallest solar tower ever built.

How does it work? All those tens of thousands of mirrors are hooked up to a computer operated tracking system so that they all move precisely with the orbit of the earth around the sun throughout the day and direct the heat from the sunlight to a spot on the boiler on top of the tower to within 0.0015499969 of an inch. The super hot water in the boiler produces superheated steam, which is then conveyed through pipes down below with enough pressure to spin a steam turbine-generator at astronomical speeds needed to produce electricity. The solar run generator can put out 300 megawatts of clean electricity every day, or enough to power about 150,000 homes.

Ashalim construction in 2016 – BrightSource Energy website

Ashalim construction in 2016 – BrightSource Energy website

Another feature of the Ashalim project is the use of solar thermal technology that can store energy for use at night in order to provide consistent and reliable output of electricity. This is one of the largest renewable energy projects in the world. The facility covers an area of over 3 sq. km (2 sq. miles).

Israel’s climate is ideal for solar power, particularly in the Negev which enjoys more than 300 sunny days a year. Israel has been home to many solar technology breakthroughs, but the government has been slow in getting away from using fossil fuels for power. But that is definitely starting to change with a goal getting 10 percent of its energy needs from renewable sources by 2020 with the new solar project. Once the project is proven fully successful, Israel plans to move ahead rapidly towards renewable energy sources.

Together with the recent discovery of huge deposits of natural gas along Israel’s Mediterranean Coast, the Ashalim plant will contribute to Israel’s security by reducing dependence on fossil fuel imports. It will also keep us safe by keeping 110,000 tons of CO2 emissions per year out of the air we breathe.

Solar Energy Isn’t Just for Electricity

It can also provide carbon-free heat for a wide variety of industrial processes

By Steven Moss
View the original article here.

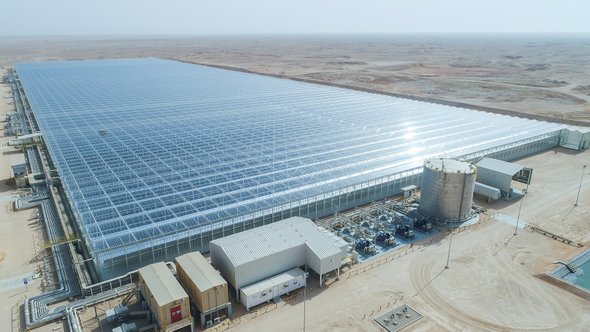
Part of the Miraah soler thermal project in Oman. Credit: GlassPoint Solar

Part of the Miraah soler thermal project in Oman. Credit: GlassPoint Solar

The industrial processes that underpin our global economy—manufacturing, fuel and chemical production, mining—are enormously complex and diverse. But they share one key input: they, as well as many others, require heat, and lots of it, which takes staggering amounts of fuel to produce. Heat and steam generation is critical to the global economy, but it’s also an overlooked and growing source of greenhouse gas (GHG) emissions.

The good news is that innovative solar technologies can produce steam at industrial scale—reducing emissions and, increasingly, cutting costs. And given the current climate outlook, it’s urgent that industry adopt these new technologies.

Despite enormous progress around the world to ramp up renewables and increase energy efficiency, global GHG emissions reached an all-time highin 2018. In a report released in January, the Rhodium Group found that even though renewable energy installations soared and coal plants shut down, carbon emissions in the U.S. rose sharply last year. Emissions from industry shot up 5.7 percent—more than in any other sector, including transportation and power generation. The authors of the Rhodium Group study concluded that despite increased efforts from policymakers and the business to tackle emissions, “the industrial sector is still almost entirely ignored.”

This must change, at the global level. Worldwide industry is responsible for a quarter of total emissions. And while those from transportation and residential segments are trending down, the International Energy Agency (IEA) projects that industrial emissions will grow some 24 percent by 2050.

As people around the world continue to transition from living off the land to moving to cities and buying and consuming more things, industrial activity will continue to increase—and the need to reduce corresponding emissions will become all the more urgent.

Credit: GlassPoint Solar

Credit: GlassPoint Solar

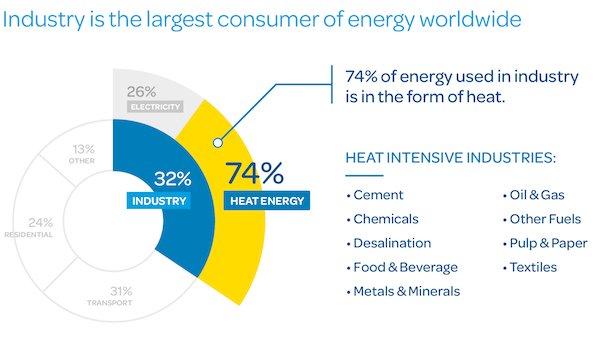
This brings us back to heat. Industry is the largest consumer of energy, and a surprising 74 percent of industrial energy is in the form of heat, mostly process steam. Solar steam—making the sun’s heat work for industry—is a largely unexplored but promising avenue for reducing emissions.

While photovoltaic (PV) panels that convert sunlight into electricity are more common, thermal solutions are what’s needed to meet industry’s growing demand for heat. In a solar thermal system, mirrors focus sunlight to intensify its heat and produce steam at the high temperatures needed for industry. Another key advantage is the ability to store the heat using simple, proven thermal energy storage in order to deliver steam 24 hours a day, just like a conventional fossil fuel plant. With the right technology, solar thermal can be a reliable, efficient and low-cost energy source for industrial steam generation.

So-called "enclosed trough technology" uses sunshine to produce zero-carbon steam. Credit: GlassPoint Solar.

So-called “enclosed trough technology” uses sunshine to produce zero-carbon steam. Credit: GlassPoint Solar.

For example, renewable process heat provider Sunvapor is partneringwith Horizon Nut to build a 50-kilowatt solar thermal installation at a pistachio processing facility in the Central Valley of California. The companies are working to expand solar steam production for food industry processes, such as pasteurization, drying and roasting.

In Oman and California, GlassPoint Solar is operating and developing some of the world’s largest solar projects for industry. GlassPoint’s greenhouse-enclosed mirrors track the sun throughout the day, focusing heat on pipes containing water. The concentrated sunlight boils the water to generate steam, which is used by Oman’s largest oil producer to extract oil from the ground. The capacity of GlassPoint’s Miraah plant, which can currently deliver 660 metric tons of steam every day, will top 1 gigawatt of solar thermal energy when completed. This same technology is also being deployed in California to reduce emissions from one of the country’s largest and oldest operating oilfields.

Meanwhile, to meet the needs of extremely high-temperature (800-1,000degreesC) industrial processes, the European Union is developing SOLPART, a research project to develop solar thermal energy that can be used to produce cement, lime and gypsum.

While fossil fuels remain the dominant source of heat for industry across all sectors and regions, industry is beginning to explore cleaner alternatives—and in some cases, industry is leveraging solar steam on a significant scale. As technology advances, more and more companies will find that switching to solar steam can simultaneously reduce costs and emissions, improving business operations while shrinking its carbon footprint.

When it comes to mitigating climate change, most attention has been directed to the things we see, buy, or use on a daily basis—the cars we drive, the food we eat, the power plants that keep our lights on. But behind all these activities is process heat, an emissions source that has been largely ignored.

Now we must turn our attention to industry—the sleeping giant of climate action. Process heat is an overlooked opportunity to slash GHG emissions, and solar technologies operating at the scale needed by industry are currently available. It’s time to embrace them and stop industrial heat from heating up our planet.

How IoT Plays A Role In Developing Sustainable Transportation

sustainable transportation iot
By Megan Nichols
View the original article here.

The Internet of Things is transforming the modern world in manifold ways. It’s making our homes smarter, our stores more connected and informed, our vehicles more powerful, and our equipment — especially the industrial variety — more capable.

“IoT” is a blanket term that refers to the entire network of connected devices, from smartphones to household appliances. IoT devices have the ability to connect with local or public networks to transmit, receive and process data streams. This means that, as a society, we can collect a lot more information about how our devices are operating. It also means we can interface with them remotely to do things like open a garage door or turn on a light from hundreds of feet or even miles away.

This technology offers a variety of benefits, including more efficient use of resources and improved sustainability practices. That’s especially true of the transportation sector and modern travel.

Airports and Air Travel

The IoT provides an added layer of convenience for customers and better sustainability for parent companies.

For customers, the technology can be used to improve their travel experience. Miami International Airport, for example, relies on connected smartphone applications to provide real-time information to passengers about campus events and locations, baggage claim info, boarding instructions and more.

As for airports themselves, the technology can help eliminate excess waste produced as a result of high energy use. Smart bulbs and connected light fixtures, for instance, can turn off lights in empty areas of the campus. Efficient thermostats can better regulate and coordinate air temperatures within the facility — not just for keeping people more comfortable, but also to use less power in the process.

Logistics and Public Transportation

Whether you’re talking about buses, above-ground trams, or high-speed trains, the logistics involved are incredible. A transport company must consider how much room they have, how many people have booked a trip, what’s changed — such as who’s canceled or joined — and even how much luggage or storage space is available.

But it doesn’t stop there. Vehicles need fuel, supplies, and maintenance — and they’re all directly tied to a strict and comprehensive schedule. Like you see with flights, if a bus or other transport is late, it affects the entire day’s schedule.

IoT technology can help with this by providing more nuanced and real-time details about the goings-on within a facility or transport. This provides much more oversight for transportation managers and planners, if not automating the entire field outright.

GPS modules can be used to track each transport with up-to-date stats like speed, fuel levels and arrival times. Bluetooth beacons can be used to deliver local information to customers’ phones and devices, with real-time alerts about delays or on-time schedules.

There’s incredible potential here, and the industry is definitely starting to catch on.

Smart Roads

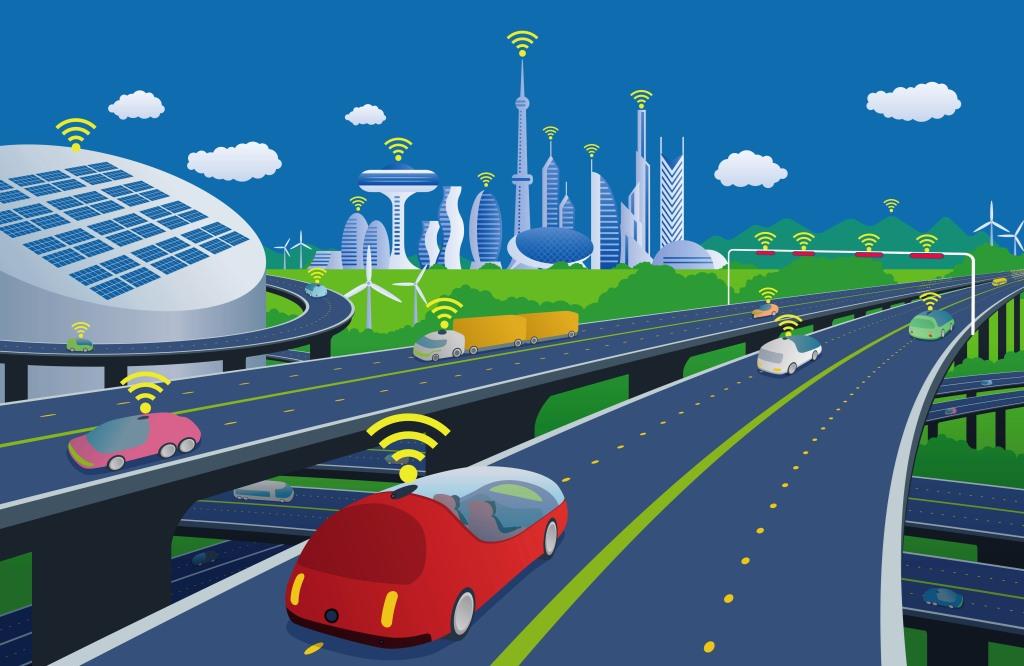
As you’d expect, smart and connected roads can help manage traffic patterns, accident response, and other related problems. Imagine receiving traffic updates on your phone directly from the very road beneath your vehicle’s tires. Highways and street surfaces can be outfitted with advanced sensors to collect usage information, which is then fed into a municipality’s traffic infrastructure. The system would be connected to traffic lights, security cameras, smart roads and much more.

It’s essentially a comprehensive modern and smart traffic management system. Sensors could pick up the impact of an accident, for example, and report that information to a remote agency or even take action via the network. As a result, nearby drivers are informed of the crash, traffic lights are changed to reflect the issue, and vehicles are rerouted until the area is cleaned up.

The technology can also be used for public road services like tollway, bridge and tunnel management — and even parking meters in urban areas.

Smarter Parking

Imagine pulling up to a parking meter, paying your fee on a mobile app, and then exiting your vehicle to be on your way. Upon your return, you simply hop in your car, tell the meter you’re leaving and away you go. The system registers the open space and alerts other drivers nearby looking for a space. As a result, the nearby roadways remain clear and less congested.

In urban areas and bustling cities, parking can be a real problem for the entire community. It can cause traffic disruptions and delays, accidents, and even dangerous scenarios — like when a vehicle is parked in front of a fire hydrant or unauthorized area.

Disney’s new parking garages in Disney Springs, Orlando, are a great example of how parking is getting smarter. Each parking row has a series of lights that turn red or green depending on whether or not space is available. As the end of each row is a digital display that shows the number of open spaces. It’s all updated in real-time so drivers can find a space quickly without driving around aimlessly. The system can also be used to locate vehicles for guests who are lost.

Supply Chain Management

In addition to self-driving transport vehicles and fleets, various other forms of transport in the supply chain are being outfitted with IoT technologies. This includes shipping trucks, containers, boats and ships, planes and more.

This provides a great deal of insight for management crews about travel times and external factors such as traffic or weather events. As with public transport, technology can be used to make more efficient use of resources like fuel as well as cut down on overall waste. More importantly, it can be used to identify new routes, transport solutions and even operational improvements.

Smart, Connected Technologies Are the Future

In the consumer market, IoT devices can help homeowners use their power supply more efficiently by cutting down on consumption, making better use of it in general and offering several new functions. Smart thermostats, for example, can auto-regulate heating and cooling in the home to make the space more comfortable and also eliminate excess use of electricity.

The same thing is happening in transportation, only on a much greater level. When an entire public transport operation is outfitted with more efficient vehicles and fuel-measuring sensors, for instance, the impact is much larger.

This shows that IoT and related connected technologies are not just a fad confined to modern-day operations — they are absolutely going to shape the future of the world. Backed by powerful data and insights, the organizations of tomorrow will be more efficient, more sustainable and much less impactful on the environment.

Solar farms in space could be renewable energy’s next frontier

space-based-solar-array-concept

Space-based solar power is seen as a uniquely reliable source of renewable energy. NASA / Artemis Innovation Management Solutions LLC

China wants to put a solar power station in orbit by 2050 and is building a test facility to find the best way to send power to the ground.

By Denise Chow and Alyssa Newcomb
View the original article here.

As the green enery revolution accelerates, solar farms have become a familiar sight across the nation and around the world. But China is taking solar power to a whole new level. The nation has announced plans to put a solar power station in orbit by 2050, a feat that would make it the first nation to harness the sun’s energy in space and beam it to Earth.

Since the sun always shines in space, space-based solar power is seen as a uniquely reliable source of renewable energy.

“You don’t have to deal with the day and night cycle, and you don’t have to deal with clouds or seasons, so you end up having eight to nine times more power available to you,” said Ali Hajimiri, a professor of electrical engineering at the California Institute of Technology and director of the university’s Space Solar Power Project.

Of course, developing the hardware needed to capture and transmit the solar power, and launching the system into space, will be difficult and costly. But China is moving forward: The nation is building a test facility in the southwestern city of Chongqing to determine the best way to transmit solar power from orbit to the ground, the China Daily reported.

REVISITING AN OLD IDEA

The idea of using space-based solar power as a reliable source of renewable energy isn’t new. It emerged in the 1970s, but research stalled largely because the technological demands were

thought to be too complex. But with advances in wireless transmission and improvements in the design and efficiency of photovoltaic cells, that seems to be changing.

“We’re seeing a bit of a resurgence now, and it’s probably because the ability to make this happen is there, thanks to new technologies,” said John Mankins, a physicist who spearheaded NASA efforts in the field in the 1990s before the space agency abandoned the research.

Population growth may be another factor driving the renewed interest in space-based solar power, according to Mankins. With the world population expected to swell to 9 billion by 2050, experts say it could become a key way to meet global energy demands — particularly in Japan, northern Europe and other parts of the world that aren’t especially sunny.

“If you look at the next 50 years, the demand for energy is stupendous,” he said. “If you can harvest sunlight up where the sun is always shining and deliver it with essentially no interruptions to Earth — and you can do all that at an affordable price — you win.”

MAKING IT A REALITY

Details of China’s plans have not been made public, but Mankins says one way to harness solar power in space would be to launch tens of thousands of “solar satellites” that would link up to form an enormous cone-shaped structure that orbits about 22,000 miles above Earth.

The swarming satellites would be covered with the photovoltaic panels needed to convert sunlight into electricity, which would be converted into microwaves and beamed wirelessly to

ground-based receivers — giant wire nets measuring up to four miles across. These could be installed over lakes or across deserts or farmland.

Mankins estimates that such a solar facility could generate a steady flow of 2,000 gigawatts of power. The largest terrestrial solar farms generate only about 1.8 gigawatts.

If that sounds promising, experts caution that there are still plenty of hurdles that must be overcome — including finding a way to reduce the weight of the solar panels.

“State-of-the-art photovoltaics are now maybe 30 percent efficient,” said Terry Gdoutos, a Caltech scientist who works with Hajimiri on the space-based solar research “The biggest challenge is bringing the mass down without sacrificing efficiency.”

For its part, the Caltech team recently built a pair of ultralight photovoltaic tile prototypes and showed that they can collect and wirelessly transmit 10 gigahertz of power. Gdoutos said the prototypes successfully performed all the functions that real solar satellites would need to do in space, and that he and his colleagues are now exploring ways to further reduce the weight of the tiles.

THE ROAD AHEAD

China hasn’t revealed how much it’s spending to develop its solar power stations. Mankins said that even a small-scale test to demonstrate the various technologies would likely cost at least $150 million, adding that the swarming solar satellites he envisions would cost about $10 billion apiece.

Despite its exorbitant price tag, Mankins remains a staunch advocate of space-based solar power.

“Ground-based solar is a wonderful thing, and we’ll always have ground-based solar,” he said. “For a lot of locations, rooftop solar is fabulous, but a lot of the world is not like Arizona. Millions of people live where large, ground-based solar arrays are not economical.”

Mankins hailed recent developments in the field and said he is keen to follow China’s new initiative. “The interest from China has been really striking,” he said. “Fifteen years ago, they were completely nonexistent in this community. Now, they are taking a strong leadership position.”

The Price of Large-Scale Solar Keeps Dropping

JOHN ROGERS, SENIOR ENERGY ANALYST, CLEAN ENERGY | SEPTEMBER 13, 2018, 11:49 AM EST
View the original article here.

PV modules at the Kerman site near Fresno, California
The latest annual report on large-scale solar in the U.S. shows that prices continue to drop. Solar keeps becoming more irresistible.

The report, from Lawrence Berkeley National Laboratory (LBNL) and the US Department of Energy’s Solar Energy Technologies Office, is the sixth annual release about the progress of “utility-scale” solar. For these purposes, they generally define “utility-scale” as at least 5 megawatts (three orders of magnitude larger than a typical residential rooftop solar system). And “solar” means mostly photovoltaic (PV), not concentrating solar power (CSP), since PV is where most of the action is these days.

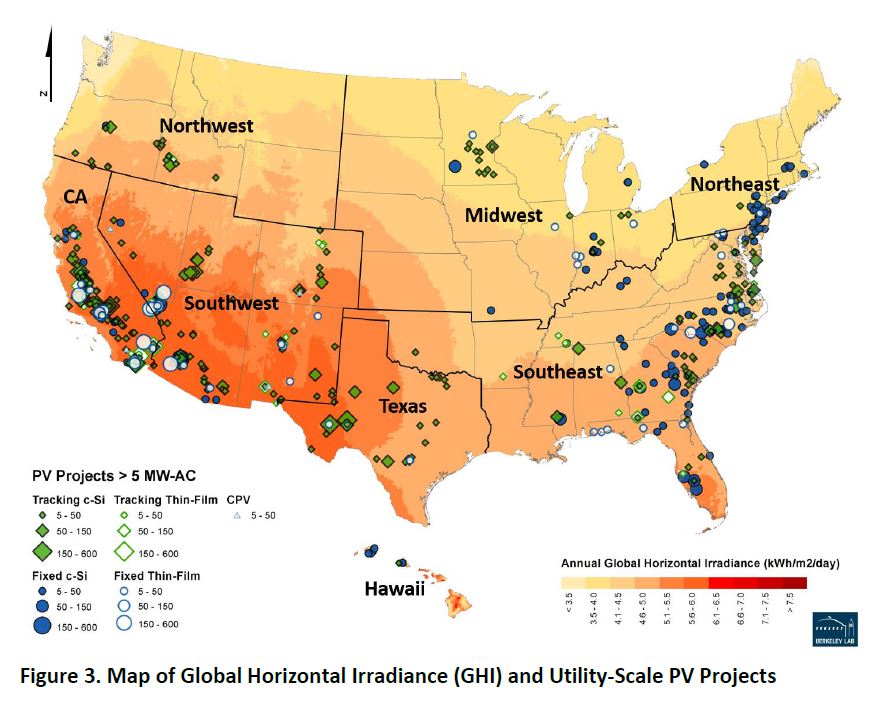
Here’s what the spread of large-scale solar looks like:

Solar Drop 2

In all, 33 states had solar in the 5-MW-and-up range in 2017—four more than had it at the end of 2016. [For a cool look at how that map has changed over time, 2010 to 2017, check out this LBNL graphic on PV additions.]

Watch for falling prices

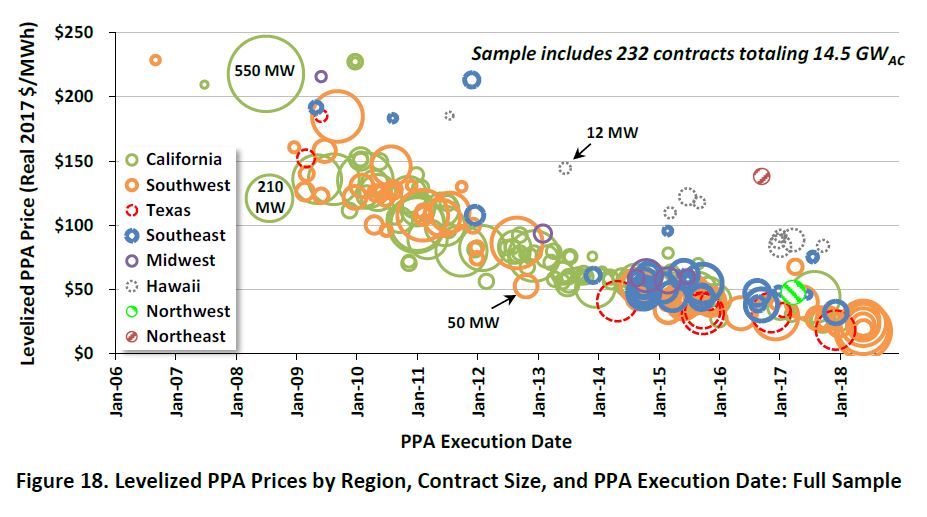
Fueling—and being fueled by—that growth are the reductions in costs for large-scale projects. Here’s a look at power purchase agreements (PPAs), long-term agreements for selling/buying power from particular projects, over the last dozen years:

Solar Drop 3

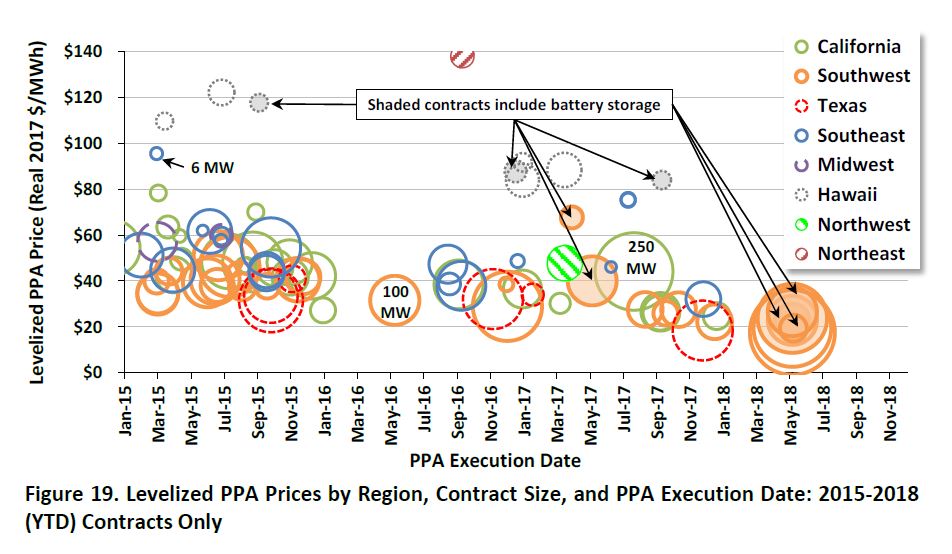
And here’s a zoom-in on the last few years, broken out by region:

Solar Drop 4

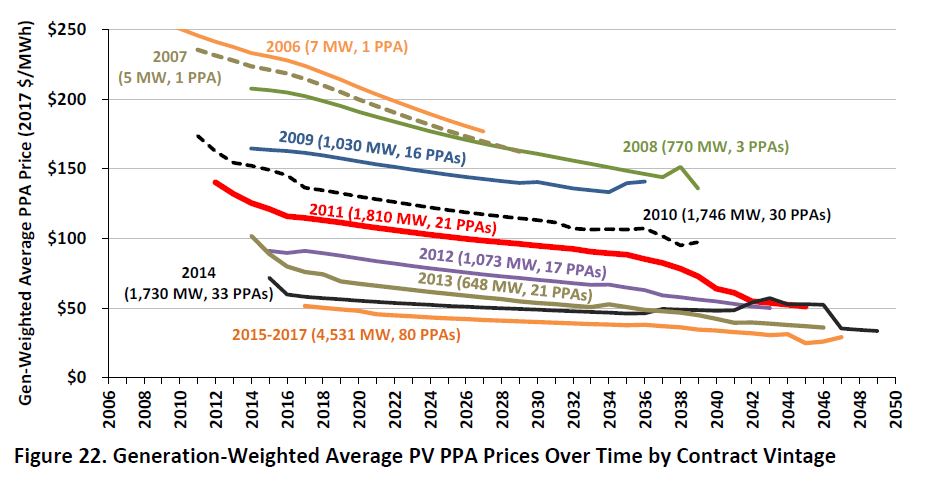
While those graphs show single, “levelized” prices, PPAs are long-term agreements, and what happens over the terms of the agreements is worth considering. One of the great things about solar and other fuel-free electricity options is that developers can have a really good long-term perspective on future costs: no fuel = no fuel-induced cost variability. That means they can offer steady prices out as far as the customer eye can see.

And, says LBNL, solar developers have indeed done that:

Roughly two-thirds of the contracts in the PPA sample feature pricing that does not escalate in nominal dollars over the life of the contract—which means that pricing actually declines over time in real dollar terms.

Imagine that: cheaper over time. Trying that with a natural gas power plant would be a good way to end up on the losing side of the contract—or to never get the project financed in the first place.

Here’s what that fuel-free solar steadiness can get you over time, in real terms:

Solar Drop 5

What’s behind the PPA prices

So where might those PPA price trends be coming from? Here are some of the factors to consider:

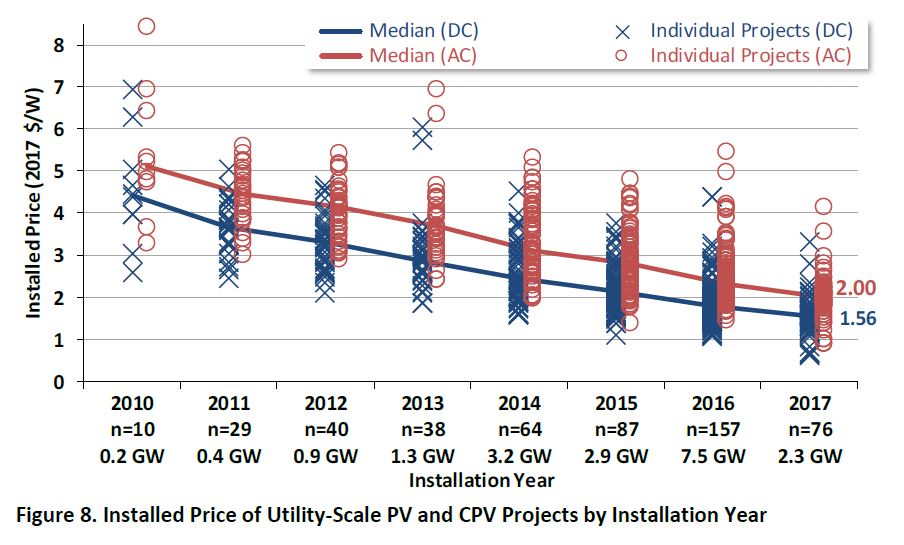
Equipment costs. Solar equipment costs less than it used to—a lot less. PPAs are expressed in cost per unit of electricity (dollars per megawatt-hour, or MWh, say), but solar panels are sold based on cost per unit of capacity ($ per watt). And that particular measure for project prices as a whole also shows impressive progress. Prices dropped 15% just from 2016 to 2017, and were down 60% from 2010 levels.

Solar Drop 6

The federal investment tax credit (30%) is a factor in how cheap solar is, and has helped propel the incredible increases in scale that have helped bring down costs. But since that ITC has been in the picture over that whole period, it’s not directly a factor in the price drop.

Project economies of scale. Bigger projects should be cheaper, right? Surprisingly, LBNL’s analysis suggests that, even if projects are getting larger (which isn’t clear from the data), economies of scale aren’t a big factor, once you get above a certain size. Permitting and other challenges at the larger scale, they suggest, “may outweigh any benefits from economies of scale in terms of the effect on the PPA price.”

Solar resource. Having more of the solar happen in sunnier places would explain the price drop—more sun means more electrons per solar panel—but sunnier climes are not where large-scale solar’s growth has taken it. While a lot of the growth has been in California and the Southwest, LBNL says, “large-scale PV projects have been increasingly deployed in less-sunny areas as well.” In fact:

In 2017, for the first time in the history of the U.S. market, the rest of the country (outside of California and the Southwest) accounted for the lion’s share—70%—of all new utility-scale PV capacity additions.

The Southeast, though late to the solar party, has embraced it in a big way, and accounted for 40% of new large-scale solar in 2017. Texas solar was another 17%.

But Idaho and Oregon were also notable, and Michigan was one of the four new states (along with Mississippi, Missouri, and Oklahoma) in the large-scale solar club. (And, as a former resident of the great state of Michigan, I can attest that the skies aren’t always blue there—even if it actually has more solar power ability than you might think.)

Capacity factors. More sun isn’t the only way to get more electrons. Projects these days are increasingly likely to use solar trackers, which let the solar panels tilt face the sun directly over the course of the day; 80% of the new capacity in 2017 used tracking, says LBNL. Thanks to those trackers, capacity factors themselves have remained steady in recent years even with the growth in less-sunny locales.

What to watch for

This report looks at large-scale solar’s progress through the early part of 2018. But here are a few things to consider as we travel through the rest of 2018, and beyond:

  • The Trump solar tariffs, which could be expected to raise costs for solar developers, wouldn’t have kicked in in time to show up in this analysis (though anticipation of presidential action did stir things up even before the tariff hammer came down). Whether that signal will clearly show in later data will depend on how much solar product got into the U.S. ahead of the tariffs. Some changes in China’s solar policies are likely to depress panel prices, too.
  • The wholesale value of large-scale solar declines as more solar comes online in a given region (a lot of solar in the middle of the day means each MWh isn’t worth as much). That’s mostly an issue only in California at this point, but something to watch as other states get up to high levels of solar penetration.
  • The investment tax credit, because of a 2015 extension and some favorable IRS guidance, will be available to most projects that get installed by 2023 (even with a scheduled phase-down). Even then it’ll drop down to 10% for large-scale projects, not go away completely.
  • Then there’s energy storage. While the new report doesn’t focus on the solar+storage approach, that second graphic above handily points out the contracts that include batteries. And the authors note that adding batteries doesn’t knock things completely out of whack (“The incremental cost of storage does not seem prohibitive.”).

And, if my math is correct, having 33 states with large-scale solar leaves 17 without. So another thing to watch is who’s next, and where else growth will happen.

Many of the missing states are in the Great Plains, where the wind resource means customers have another fabulous renewable energy option to draw on. But solar makes a great complement to wind. And the wind-related tax credit is phasing out more quickly than the solar ITC, meaning the relative economics will shift in solar’s favor.

Meanwhile, play around with the visualizations connected with the new release (available at the bottom of the report’s landing page), on solar capacity, generation, prices, and more, and revel in solar’s progress.

Large-scale solar is an increasingly important piece of how we’re decarbonizing our economy, and the information in this new report is a solid testament to that piece of the clean energy revolution.