Climate Change

COVID-19: The Wake-Up Call The Energy Sector Needed

By: Jemma Green
View the original article here

Perhaps Henry David Thoreau was onto something when he set out solo for a cabin in the woods with the aim of becoming completely self-sustainable – for one, he wouldn’t really need to stress about a contagious pandemic. 

Thoreau’s experience would later shape the 19th century literary classic Walden; or, Life in the Woods, detailing how he was able to rely solely on himself, including growing his own food and sourcing firewood for heat and light at night. 

Whether he knew it or not Thoreau was excelling at social distancing and we could all take a leaf out of his book. 

Because, while most of us have got the idea of self-isolation down pat, I bet few are likely to pass the self-sufficiency test.

You only have to look at recent purchasing trends to see some of the panic stemming from a lack of self-sufficiency to see this ‘test’ in action. 

First it was the toilet paper and tinned food, before spreading to plants, with a nursery’s months-worth of vegetables and seedlings stock sold over one weekend. 

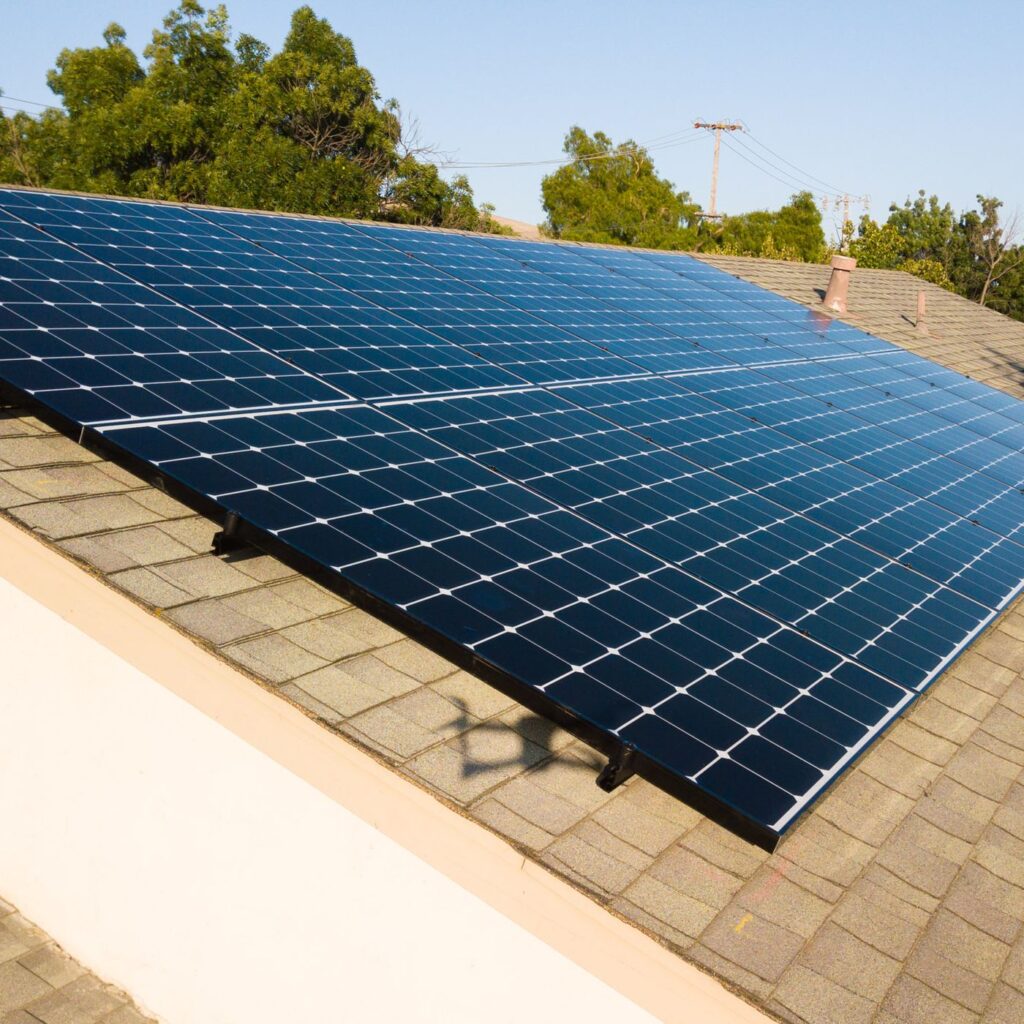
Next up: renewable energy infrastructure, as demonstrated by one solar retailer experiencing a 41 percent jump in PV sales and a 400 percent increase in battery enquiries over the past two weeks. 

But where were these eco warriors, cultivating their own veggie patches and living ‘off-grid’ before the apocalyptic hysteria hit? 

If history is any proof, crises are often the perfect kindling for igniting change, especially when standards of living are threatened. 

And the COVID-19 crisis has certainly given the energy world a wake-up call when it comes to sustainability.  

Mother nature gets a well deserved break 

Amid coronavirus-induced lockdowns, shutdowns and working from home, air pollution has significantly dropped worldwide.

In New York, carbon monoxide levels, largely produced from cars, have fallen by nearly 50 percent compared with the same time last year. 

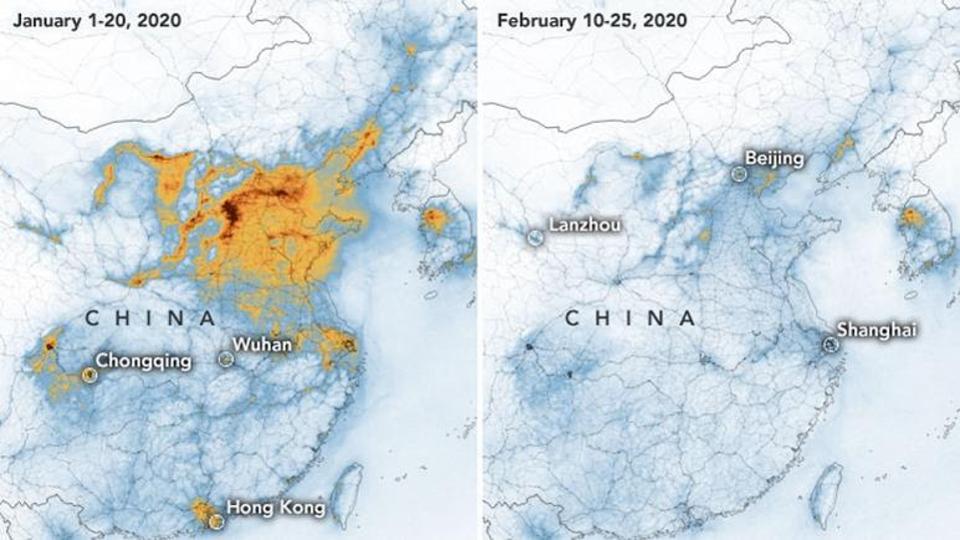
Greenhouse gas emissions in China have also plummeted with NASA releasing images where you can see the country’s reduction in nitrogen dioxide from space. 

Nitrogen dioxide emissions over China – Copyright NASA Earth Observatory by Joshua Stevens, using modified Copernicus Sentinel 5P data processed by the European Space Agency  – NASA

According to one analysis, the slowdown of economic activity in China led to an estimated 25 percent reduction in carbon emissions in just four weeks. 

The restriction on air travel, or any travel at all, has also clearly played a role in reducing pollutants.

And whether you choose to believe the stories of wildlife returning to cities, like dolphins and swans returning to Venice canals, coronavirus has certainly given mother nature a well-deserved moment of respite. 

However, this has been at the expense of economic development, of jobs and livelihoods – and it’s certainly not going to be long-term. 

Air pollutants will likely jump once day-to-day normalities resume. 

However, if we’re smart about it, we can use this period to re-evaluate our energy systems to help flatten the emissions curve and keep our air clean.

Energy systems under pressure 

Aside from the closure of factories and reduction in fuel-consuming transport, we can’t forget that data centers and server-farms are also huge energy-intensive industries. 

Collectively, these spaces represent approximately two percent of the United State’s total electricity use. 

In the UK, there’s been reports of home-working intensifying pressure on the electricity network, instead of being in the office where lighting, heating and cooling are shared. 

Now everyone’s either working from home, or just at home, internet use and streaming is peaking. 

A study by SaveOnEnergy estimated energy generated from the 80 million views on Netflix’s NFLX thriller Birdbox was equal to the equivalent of driving more than 146 million miles and emitting just over 66 million kilograms of CO2 – what it takes to drive from London to Istanbul and back 38,879 times. 

Beyond the environmental impact, coronavirus has brought more attention to the question of whether our current energy systems and frameworks can actually keep up with increasing demand pressures.  

Several country-appointed energy councils have met to discuss electricity demand pressures related to COVID-19, with renewable energy a popular topic. 

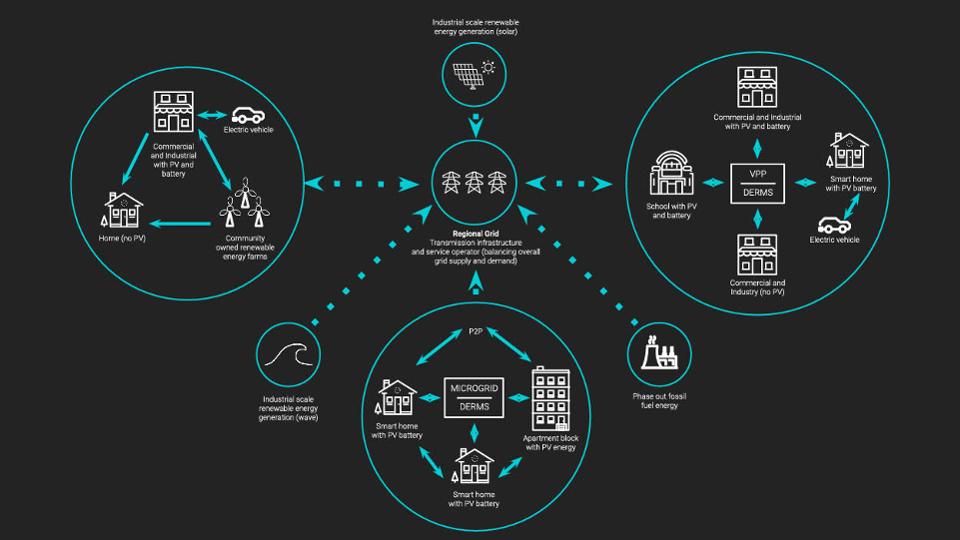
In a meeting between Australia’s federal, state and territory energy ministers, the transition towards a genuine two-sided market was emphasized – where consumers become prosumers by contributing excess rooftop solar and battery electricity to the grid.

This would play a large role in forming a ‘day-ahead’ market, to “address concerns that managing challenges like system strength is becoming increasingly difficult with only a real-time market”. 

On top of this, the Australian Government’s Economic Response to the Coronavirus actually includes tax deduction incentives for commercial and industrial solar PV, in a bid to help alleviate financial pressure through reduced electricity bills. 

Digital transformation is underway across the energy sector, with significant advancements in renewable energy technologies and the ways in which energy is distributed. 

For any real change to occur, you need people to switch perspectives.

Powering new mindsets

Tough times spark innovation. Now is as good a time as any to test new energy systems and processes, and it starts with a shift in thinking. 

Energy networks, retailers and operators have delivered services in much the same way for a century – driven by fossil-fuels. 

New technology is making it easier, more effective and affordable to use renewable energy, and the costs associated with installing those technologies, such as solar and batteries are decreasing.

And most industry players recognise the need to change and evolve in order to remain relevant, or are at least are starting to, with a little nudge from COVID-19. 

Self-generating renewable energy infrastructure gives people the power to become self-sufficient for their electricity needs, with some even going ‘off-grid’ altogether. 

National Energy Market retailer Powerclub is one company already trialling new technology to help alleviate demand pressure on the grid via a Virtual Power Plant (VPP) in South Australia and is currently calling for more households to join. 

The VPP enables Powerclub households with batteries to sell their stored, excess solar back to the grid during peak demand periods and price hikes, via peer-to-peer energy trading technology. 

There is a huge benefit to the broader community in that the VPP gives those who may not be able to afford solar panels, or those who are renting, the opportunity to access clean energy. 

As great as it is to think of only the environmental benefit that comes with using clean energy, a monetary incentive certainly makes the proposition more appealing. 

Not only does a VPP provide renewable energy infrastructure owners with a passive income, it can also provide an incentive for others to install solar panels – knowing they’ll be able to pay back their investment faster. 

Pair a VPP with home grown vegetables and you’re a little closer to achieving Thoreau’s vision for self-sufficiency. 

Where to from here? 

At the end of the day, it shouldn’t take a pandemic for people to reconsider their impact on the environment – but it has. 

We’re now being given a chance to press reset on many areas of our lives and reconsider what it takes and what choices to make in order to lead a more sustainable lifestyle. 

Energy regulators are on the right track with numerous initiatives and policy changes currently underway.

But you could make a change right now – how we return to normal life post COVID-19 could lay the foundations for a cleaner and more resilient energy future.

Why does that matter? Well, as Thoreau said; “What is the use of a house if you don’t have a decent planet to put it on?”

2020 Renewable Energy Industry Outlook

Exploring renewable energy policy, innovation, and market trends

Follow this link to download the full report.

The renewable energy industry is primed to enter a new phase of growth driven largely by increasing customer demand, cost competitiveness, innovation, and collaboration. But will challenges surrounding trade and tariff policy require the industry to prioritize risk mitigation tactics? Our 2020 renewable energy industry outlook explores what it will take for companies to thrive in the year ahead.

Renewable energy industry primed for continued growth

For the first time ever, in April 2019, renewable energy outpaced coal by providing 23 percent of US power generation, compared to coal’s 20 percent share.1 In the first half of 2019, wind and solar together accounted for approximately 50 percent of total US renewable electricity generation, displacing hydroelectric power’s dominance.

Declining costs and rising capacity factors of renewable energy sources, along with increased competitiveness of battery storage, drove growth in 2019. In the first half of the year, levelized cost of onshore wind and utility-scale solar declined by 10 percent and 18 percent, respectively, while offshore wind took a 24 percent dip.2 The greatest decline was in lithium-ion battery storage, which fell 35 percent during the same period.3 This steady decline of prices for battery storage has begun to add value to renewables, making intermittent wind and solar increasingly competitive with traditional, “dispatchable” energy sources.

The renewable energy sector saw significant demand from most market segments as overall consumer sentiment remained positive. Renewable energy consumption by residential and commercial customers increased 6 percent and 5 percent, respectively, while industrial consumption declined slightly, by 3 percent, through June 2019 compared with the previous year.4 As in 2018, US corporate renewable energy contracts once again hit new levels, as corporations signed power purchase agreements (PPAs) for 5.9 gigawatts (GW) of renewable energy in the first half of 2019.5

The prospects for short-term solar and wind energy growth appear favorable, with about 96.6 percent of net new generation capacity additions (~74 GW) expected to come from these two resources in 2020.With several states increasing their renewable portfolio standards (RPS) in 2019, the industry will likely see mandatory RPS-driven procurement growth through the mid-2020s, while voluntary demand will continue to hit new levels. As of late 2019, at least 10 utilities have announced 100 percent decarbonization goals, and we’ll be watching for that list to grow in 2020.7

Moving into 2020, companies in the renewable energy industry should be mindful of a few caveats that could impact renewable energy growth. Under current policy, eligibility for the Production Tax Credit (PTC) for new wind build expires and the solar Investment Tax Credit (ITC) step down starts in 2020, both of which have been key drivers for wind and solar growth in the US renewable energy market.

While the wind industry did not request extension of the PTC before it expires next year8, it has requested that solar energy’s ITC be extended to wind projects.9 The solar industry, however, did request an ITC extension. In July 2019, both houses of Congress introduced legislation to extend the solar ITC for five years at its full 30 percent value.10 We’ll be watching to see if this becomes law by yearend or is taken up again in 2020, and whether wind will be included. For sectors that have worked together toward a cleaner energy mix, taking separate paths would likely create new industry dynamics.

We will also be watching US tariff policies throughout 2020. Solar developers are optimistic, since imported panel costs have fallen rapidly and are likely to offset the impact of existing tariffs by the end of 2019.11 That’s good news for growth as long as new tariffs are not imposed. However, the US government expanded tariffs on Chinese imports, most recently including bifacial solar modules, and is considering increasing tariff amounts.12 The wind industry expects record growth for 2019–2020 before the PTC phaseout, but we’re keeping an eye on recently proposed tariffs on imported wind towers from several countries. If these tariffs are imposed on top of existing tariffs on towers and other equipment from China—and existing multi-country steel tariffs—the upward pressure on prices could stymie some new projects.13 Overall, the decline in wind and solar construction costs—weighted project costs fell 13 percent and 37 percent, respectively, between 2013–2017—will likely help cushion the impact of tariffs on imported components.14

2020: Renewable energy industry poised to enter new growth phase

The year ahead promises further growth in the renewable energy sector. This will likely come against a backdrop of increased innovation and collaboration among multiple stakeholders. Renewables are likely to continue moving into the driver’s seat in electricity markets as utilities and regulators prefer them to replace retiring capacity and customers increasingly choose them to save costs and address climate change concerns. Growth in the US offshore wind sector will likely bring multiple opportunities for industry players as states vie for manufacturing and port infrastructure projects. Grid resiliency will also likely be a growing driver for distributed renewable deployment as utilities and their customers increasingly consider renewable microgrids combined with storage solutions. However, trade and tariff policy uncertainty will likely keep the industry on the lookout for risk mitigation tactics. But companies that are ready to innovate, collaborate, and seize new opportunities will likely thrive in a new phase of renewable growth.

​Sustainability Trends That Will Shape the 2020’s

View the original article here.

In the past decade, the topic of “sustainability trends” has been a subject of great discussion. As we approach a new decade with our climate in crisis, it becomes more important than ever to keep up with and invest in the latest in sustainability efforts- particularly in the world of business. We asked over one hundred eco-minded business leaders what they saw as the sustainability trends that will shape the next decade. Here are the top ten trends they identified. From relying on renewable energy to eating smarter, we were excited to see that they were largely positive and optimistic! 

1. CHANGES TO ENERGY PRODUCTION

One of the most talked about sustainability trends is reducing our dependence on fossil fuels. Fossil fuels are nonrenewable sources of energy and are the leading contributor to climate change. In the United States, they’re to blame for more than 80 percent of greenhouse gas emissions — and 98 percent of CO2 emissions alone.

As of 2017, fossil fuels accounted for 80 percent of the energy in the US. While this number seems depressing, this is the lowest share since 1902! Renewables now account for 11 percent, the highest share since the late 1910s.

This is a promising reminder of the fact that collective efforts to invest in and improve our energy infrastructure are having a meaningful impact, and many of you felt hopeful that solar and wind energy will become far more commonplace in the next decade.

Caio Bersot at EnergyRates.ca reminded us that not only are solar and wind energy technologically promising, the trends towards micro-generation of electricity in homes using these renewable energy technologies is also extremely promising. Whether wind turbine, solar panels or even geothermal energy, renewable energy tech is becoming increasingly affordable. This will probably enable people to invest in renewable energy sources without having to spend too much on installation costs.

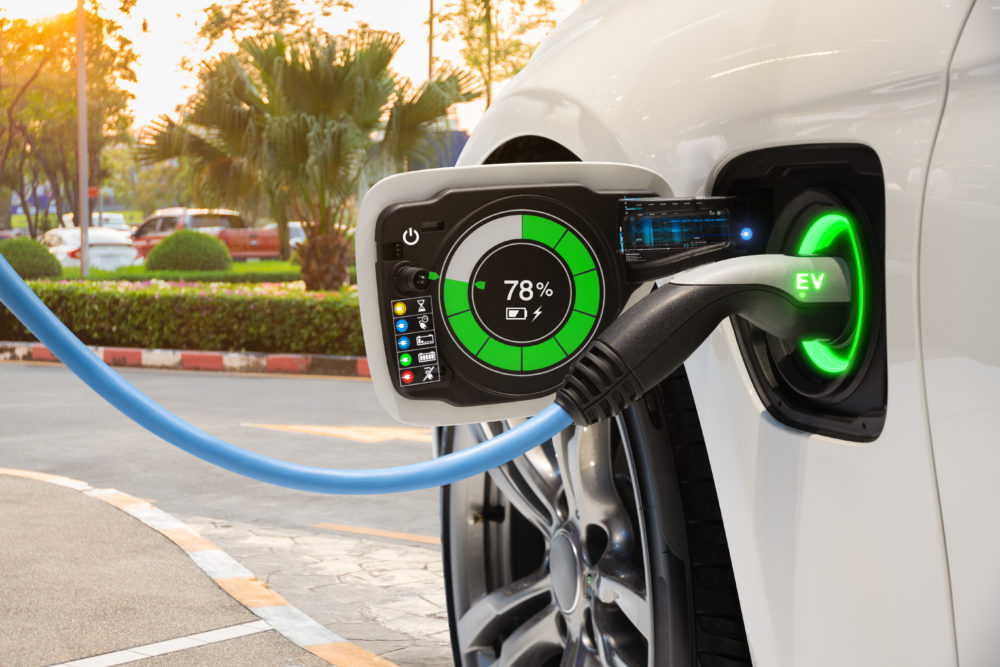
Electric vehicle changing on street parking with graphical user interface, Future EV car concept

2. REDUCTION IN OUR ENERGY CONSUMPTION

Another one of the most promising sustainability trends in business is reducing energy consumption. Electric vehicles (especially to fuel freight transportation), LED lighting, smart homes, and LEED certified buildings were all mentioned frequently as critical areas of forward progress because they change how we consume energy (and how MUCH electricity and fuel we consume).

Catherine Pears at Wavelength Lighting shared that in commercial spaces, the installation of LED lighting is less of a fleeting trend and more of a necessary shift required of any energy-efficient building. Legislation in cities like New York City and Berkley, California are already implementing requirements for lighting upgrades to commercial buildings above a certain size— because there is simply no need to be wasting so much energy by keeping traditional light sources (like CFL and incandescent) in place. Now that LEDs have caught up to traditional lighting in terms of price point, and actually pay themselves back in a short amount of time, the choice is pretty clear: choose LEDs and save energy and money.

Liz Jeneault of Faveable saw electric vehicles as the most promising trend. In the coming year and beyond, we absolutely will see people purchasing more plug-in hybrid and fully electric vehicles. Everyone is familiar with Tesla, but automakers across the board are offering or developing more eco-friendly options. Many of the vehicles are coming in the form of an SUV. The SUV segment continues to rise in popularity, as people want just the right of amount performance, comfort, and spaciousness. They don’t want the gas guzzlers of the past, however.

That’s why new vehicles like the Audi e-tron have been such a big hit. The SUV is fully electric, but offers excellent performance. I definitely feel having more zero-emissions vehicle options out there will help consumers make smarter choices for the environment. Reducing our personal carbon emissions is a great way to help address global warming. Since many of us drive so much, opting for a plug-in hybrid or fully electric vehicle can have a big impact.

Caio Bersot also highlighted trends towards a smart home. People buy personal assistants, motion sensors, smart lockers and bulbs, cleaning robots, and smart appliances all the time. The main reason is that such devices make your life more comfortable and practical. However, brands are starting to notice the importance of adding sustainability to the mix. Smart home gadgets will become each time more energy-efficient, be it by using less electricity or for actively preventing you from spending more energy than you should. This will include smart light bulb kits, smart power strips, smart thermostats, smart energy monitors and even smart curtains.

3. PLANT BASED EATING

The next in our series of sustainable trends attempts to mitigate the environmental impact of our diets. Many responses to this question were optimistic about recent trends towards plant-based eating and meat substitutes. It’s no secret that eating meat has a big impact on the planet. Within the United States, agriculture and forestry together accounted for 9.0 percent of U.S. greenhouse gas emissions in 2017 (not to mention the negative impact that agriculture has on soil and waterways). What does this have to do with meat? 26 percent of the earth’s land is actually used for livestock grazing and one-third of the planet’s arable land is occupied by crop production used entirely as livestock feed.

According to John Moss, of English Blinds, the rise of veganism is perhaps the main sustainability trend to watch over the next decade. Nestle, the world’s largest food conglomerate, states that “the plant-based food trend is here to stay,” and America’s top takeaway marketplace GrubHub states that demand for orders of plant-based food have reached an all-time high. In fact, GrubHub’s data indicates that orders of vegan food increased 19% in the first half of 2017 compared to the same period of 2016, and GlobalData identified a 5% rise in the number of data subjects identifying as vegan between 2014 and 2017.

The ability to eat vegan without spending huge amounts of time and money doing so has also increased exponentially in recent years, making this a much more viable option for people who might have previously ruled it out due to time or financial constraints, which is helping veganism as a whole to snowball.

Sylvain Rochon was particularly favorable towards simulated meat substitute products like the Impossible Burger and lab-grown meat.

The “meatless meat” market is growing very quickly because most people don’t care whether their burger or steak is made of actual meat or not. They like the taste and texture and how it feels. These companies like Impossible Foods figured out a way to put vegetables together to simulate color, texture and taste of meat. Since real meat is environmentally problematic and expensive to produce, most people, taste and texture being equal, would prefer to buy the less expensive alternative “veggy-meat” than the real thing.

Lab-grown meat, once ready for mass production and cost-effectiveness, can be an amazingly effective alternative to real meat, giving rise to designer meats. It is much easier to alter muscle cells in a lab environment for taste, texture, color and shape than to do that on a real live animal. So expect different varieties of muscle cell cultures to emerge as sources for future meats without the need to harvest any cells from animals anymore.

And, just like vertical farming in controlled environments, lab-grown meats can be produced within city borders, near distribution centers. This is all great for the consumer’s health, our wallets and the environment, and it is all made possible by the massive amount of investment made in artificial intelligence plus automation over the past few years.

4. REGENERATIVE AGRICULTURE

While many were focused on plant based eating trends, others felt that regenerative agriculture, to support both plants and livestock production, is the more important game changing wave of progress.

Lucinda Cramsey of Moink Box highlights,there are only 60 years left of top soil on this earth if we do not take a step toward regenerative farming. I was born a poor farmer in LaBelle, MO, where I still live today. I’ve seen how big ag. companies abused the family farm, and their land. Without our top soil, we have no food. Without food, we have nothing as humans.

Regenerative agriculture – defined as a system of farming principles and practices that increases biodiversity, enriches soils, improves watersheds, and enhances ecosystem services – is an antidote to our current depletion of topsoil.

Regenerative Agriculture aims to capture carbon in soil and aboveground biomass, meaning that it can feed the planet while simultaneously reversing current global trends of atmospheric accumulation.

Nonprofit Regeneration International claims that transitioning 10% to 20% of agricultural production to best practice regenerative systems could sequester enough carbon dioxide to reverse climate change. That seems like a bold claim, but many independent farmers have been astounded by the results they’ve seen. Take, for example, Gabe Brown who moved to regenerative practices on his ranch in Bismark, North Dakota. Organic matter and rainwater uptake tripled while he was able to handle five-times the number of cattle he used to.

With big brands like Patagonia, Dr. Bronners and Justin’s Nut Butters behind the regenerative agriculture movement, this trend certainly holds promise.

5. CHANGES TO OUR RELATIONSHIP WITH PLASTIC

Many felt that the tides were finally turning on our relationship with single use plastic, in large part driven by the growing awareness of ocean plastic pollution and its impact on ocean life, acidification and the food and water we consume.

Louis Watton of Shiply shared, I believe that cutting down on excess plastic packaging has been and will continue to be the biggest sustainability trend over the next decade, and will have a big impact on both businesses and consumers.

The packaging industry is the single largest producer of plastic. In 2015 there was roughly 146 million tonnes of plastic produced for packaging (over twice the amount that was produced for building and construction) and 141 million tonnes of that plastic is wasted – as such, targeting this industry is very important in the fight for sustainability.

As long as high profile programs such as Blue Planet 2 continue to bring attention to the undeniable negative impact such massive plastic production and waste has on our planet I believe consumers will be hyper-aware of the products they buy and how they are packaged.

John Moss of English Blinds echoed these sentiments. The consumer-led drive to cut down on the use of nonrecyclable plastics is already well underway and this is a trend that is only going to strengthen and snowball in the coming decade. We’re already in a position where a significant number of consumers across all demographic groups are willing to call out businesses of every caliber on the needless use of disposable plastics, and/or vote with their feet when it comes to leaving stores with poor plastic credentials without making a purchase.

Robert Piller of Eco Marketing Solutions reminded us that much damage has already been done. [Plastic reduction] will continue to trend, but will it help reverse ecological challenges? Well, that remains to be seen. The damage done so far is staggering, as between 4.8 and 12.7 million metric tons of plastic materials end up in oceans each year (National Center for Ecological Analysis and Synthesis), and 100,000 mammals and 1 million seabirds are killed each year by consuming plastics (The Ocean Conference). Fixing this problem would require every business and consumer to go green in a big and bold way.

6. CHANGES TO RECYCLING AND COMPOSTING

While strides have been made with composting and recycling in the US and worldwide, both have major challenges. Between the China Ban (and our even more problematic recycling practices before the China Ban) and composters struggling to accommodate (and now banning) materials like bioplastic that add no nutrients to their output, our system of sustainable waste management needs an overhaul.

Many responses were optimistic about technologies that can help us improve both recycling and composting in the future.

Jeff Kneal of The Critter Depot reminded us that our longstanding approach to composting (designed largely for yard waste) is not ideal going forward. One of the biggest trends is composting with black soldier fly larva. Black soldier fly larva are create a highly nutritious compost, that performs better than chemical fertilizers. Black soldier fly larva can also compost meat, fish, and other complex proteins, making them more efficient than worms. BSFL will consume and produce about twice their body weight per day, reducing landfill, and the need for large trash trucks. And, because of their protein, black soldier fly larva are also great food sources for reptiles and chickens.

These types of innovations can help us significantly improve industrial composting, and the output from industrial compost.

Most respondents recognized that recycling is essential to sustainability long-term. We will continue to produce goods out of metal, glass, plastic, paper and other materials – and when these items are at the end of their life, recycling them into new useful goods is optimal.

Improving single stream recycling involves three things:

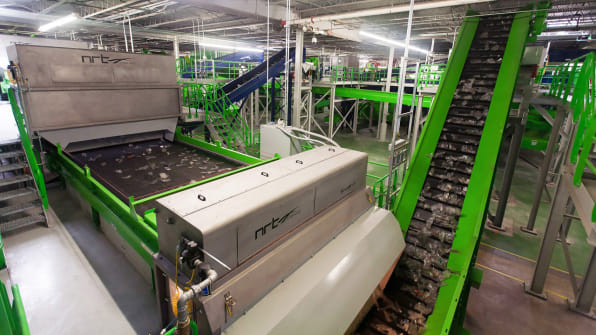
(1) improved sorting technology, so Materials Recovery Facilities can better and more cleanly sort even more waste items into separate, usable materials. An example of an innovation here is that currently needed – MRFs cannot accept plastic bags because they are so flimsy and get caught in the gears of machinery. Investments are being made to better sort this material out at the front of th sorting line. If successful, plastic film (a material that is technically fairly easy to recycle) could start being accepted curbside nationwide!

(2) improving reclaiming and remanufacturing with recycled content, so manufacturers can readily and effectively use the materials. For example, printing on recycled plastic and paper can be challenging. Colors are less vibrant. Advancements that enable manufacturers to produce goods made with 100% post consumer waste that are still excellent for printing.

(3) developing end materials and products that can be made easily with this recycled content.

For example, as highlighted by Ronald D’souza of Angel Jackets, several brands have taken the initiative of producing sustainable t-shirts made out of plastic water bottles, including the significant brand Ralph Lauren. The most notable benefit of such trend is that it replaces harmful human-made polystyrene with waste plastic bottles that would otherwise be dumped in the ocean. “Approximately 18,834,000,000 are dumped in the landfills every year. While, each plastic bottle can take up to 700 years to perish. Although this method of recycling plastic is still in its developing phase, in the next decade, we will witness more products made of plastic bottles, including Jackets, pants, bags, hats, and most wearable and even customers would opt for such items. Recycling plastic, especially for creating something sustainable is undoubtedly a positive step that will help us reverse the looming ecological challenges the world is facing.

7. GOVERNMENT REGULATION AND POLICIES

The single issue that garnered pessimism about progress was the role that governments play in pushing true, long-term progress when it comes to sustainability.

Though globally, there are a lot of countries whose political leaders have made the planet a core priority, many lamented the fact that this is not true of the US’s current administration. Many did, however, recognize that 2020 is just around the corner and that a new wave of optimism could emerge with our next election – [I’m] not at all confident under the current US administration. I’m somewhat optimistic if we see a new administration elected in 2020. Others also highlighted the role that local and state politicians have played in the US to keep environmental progress going during this time.

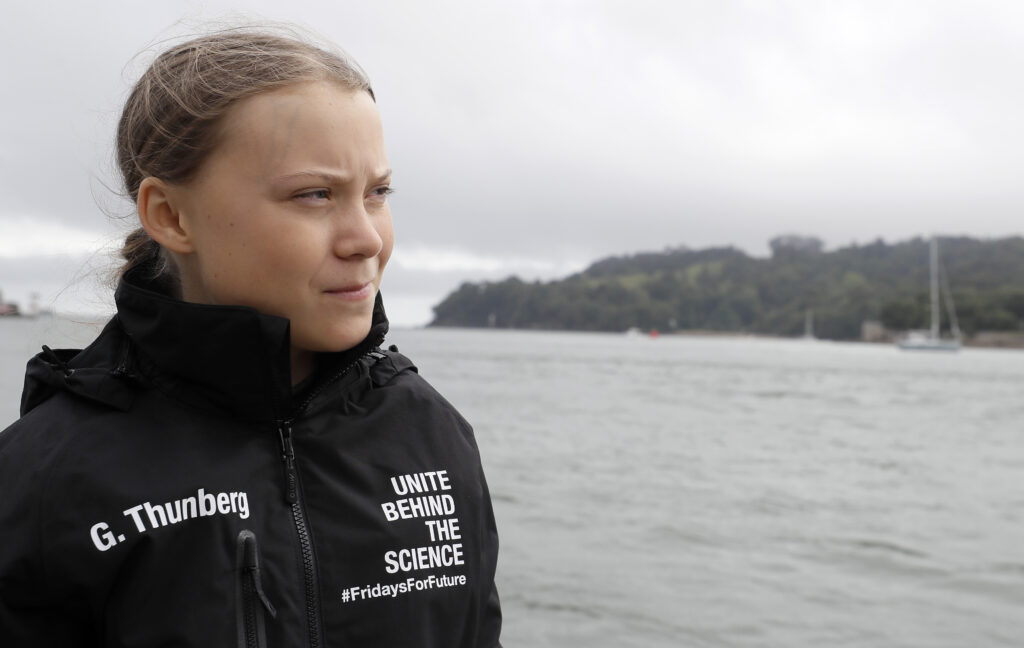
TOPSHOT – Swedish climate activist Greta Thunberg walks along the quayside to board an electric powered rib, before travelling to board the Malizia II IMOCA class sailing yacht off the coast of Plymouth, southwest England, on August 14, 2019, as she prepares to start her journey across the Atlantic to New York where she will attend the UN Climate Action Summit next month. – A year after her school strike made her a figurehead for climate activists, Greta Thunberg believes her uncompromising message about global warming is getting through — even if action remains thin on the ground. The 16-year-old Swede, who sets sail for New York this week to take her message to the United States, has been a target for abuse but sees that as proof she is having an effect. (Photo by Kirsty Wigglesworth / POOL / AFP)KIRSTY WIGGLESWORTH/AFP/Getty Images

8. CONSUMER AWARENESS AND YOUTH ADVOCATES

Even those who felt hopeless about politics voiced optimism of just how passionate the next generation of consumers and citizens is when it comes to climate change and marine plastic pollution.

There is hope of the impact this will have on companies and governments.

Dr. Nardia Haigh shared, Greta Thunberg’s Fridays for Climate movement is reinvigorating people who have worked on climate change for many years, activist investors, and other social movements in related areas. The breadth of industries affected will continue to grow. Climate change activism is no longer of concern just to energy companies, but it stands to affect all kinds of companies as these activists are consumers, students, investors, entrepreneurs, parents, and leaders. All this appears likely to make climate change a strategic issue for all companies, and therefore competition on the basis of one’s climate change credentials will continue to grow.

Sarah Hancock of Best Company shared a similar sentiment. In my opinion, the sustainability trend that will have the biggest impact on business and consumers in the next decade is the increased awareness, education, and action surrounding sustainability initiatives.

People are and will continue taking to social media and the streets to demand action from governments and businesses on environmental issues. Up-and-coming Gen Z’ers will continue to be important influencers in these movements. Expectations for companies to address issues such as climate change, deforestation, and waste will continue to grow. Consumers, especially younger ones, will increasingly shift their loyalties to companies they perceive to be acting on these issues.

As a result, I expect to see many businesses increasing their sustainability commitments through more responsible recycling practices, efforts to become more energy efficient, and donations to environmental causes. A growing number of organizations will likely take the next step and put in the necessary work to gain B Corporation status as well.

9. THE MOVE TO SLOW FASHION

Sheri Turnbow of Bespoke Southerly was one of the many respondents that highlighted the exciting trends towards sustainability in the fashion industry. Fashion is considered one of the largest industry polluters in the world.

Textile factories produce toxic wastewater, synthetic fibers get released into the ocean through washing, fast fashion has created a culture of disposable clothing where very little is recycled and most ends up in landfills — 92 million tons of solid waste dumped in landfills each year.

As a result of these issues, we are seeing trends, particularly among smaller entrepreneurial brands to implement systems to reduce waste at all stages of fashion production. Possibly the most prominent of these is the made to order model. Made to order means each garment is made when the customer orders it – so cut one at a time vs. creating vast amounts of inventory that may never be sold. This model also enables personalization and customizations of clothing that is increasingly popular with millennials.

Steven Li of The Rising echoed these sentiments. High fashion, including Burberry and Gucci can afford to source sustainable materials, but brands like H&M will have a hard time following suit. Consumers are more aware of their environmental footprint than ever before, and when it comes to fashion, consumer decisions will most certainly weigh in the sustainability of the brands they buy from. Fashion has long been an industry optimized for the end product. Supply chains often top emissions charts and it’s good to see brands are pivoting to be more sustainable.

America’s Great Climate Exodus Is Starting in the Florida Keys

By Prashant Gopal
View the original article here.

Mass migration begins as coastal homes are bulldozed in the state facing the biggest threat from climate-driven inundation.

Lori Rittel’s home in Marathon Keys, on Sept. 16

Lori Rittel’s home in Marathon Keys, on Sept. 16

Lori Rittel is stuck in her Florida Keys home, living in the wreckage left by Hurricane Irma two years ago, unable to rebuild or repair. Now her best hope for escape is to sell the little white bungalow to the government to knock down.

Her bedroom is still a no-go zone so she sleeps in the living room with her cat and three dogs. She just installed a sink in the bathroom, which is missing a wall, so she can wash her dishes inside the house now. Weather reports make her nervous. “I just want to sell this piece of junk and get the hell out,” she said. “I don’t want to start over. But this will happen again.”

Lori Rittel

Lori Rittel

The Great Climate Retreat is beginning with tiny steps, like taxpayer buyouts for homeowners in flood-prone areas from Staten Island, New York, to Houston and New Orleans — and now Rittel’s Marathon Key. Florida, the state with the most people and real estate at risk, is just starting to buy homes, wrecked or not, and bulldoze them to clear a path for swelling seas before whole neighborhoods get wiped off the map.

By the end of the century, 13 million Americans will need to move just because of rising sea levels, at a cost of $1 million each, according to Florida State University demographer Mathew Haeur, who studies climate migration. Even in a “managed retreat,” coordinated and funded at the federal level, the economic disruption could resemble the housing crash of 2008.

The U.S. government’s philosophy has been that local officials are in the best position to decide what needs to be done. Consequently, the effort has so far been ad hoc, with local and state governments using federal grants from the last disaster to pay for buyouts designed to reduce the damage from the next one.

“The scale of this is almost unfathomable,” said Billy Fleming, a landscape architecture professor at the University of Pennsylvania. “If we take any of the climate science seriously, we’re down to the last 10 to 12 years to mobilize the full force of the government and move on managed retreat. If we don’t, it won’t matter, because much of America will be underwater or on fire.”

If not for the $174,000 that Rittel, 60, owes on her mortgage, the Montana transplant would have left long ago. Insurance money is insufficient to rebuild, so she applied for one of the buyouts, administered by the state with $75 million of Irma-relief cash from the U.S. Department of Housing and Urban Development, as long as it lasts.

The inside of Lori Rittel’s home. Photographer: Jayme Gershen/Bloomberg

The inside of Lori Rittel’s home.
Photographer: Jayme Gershen/Bloomberg

Florida accounts for 40% of the riskiest coastal land in the U.S., according to the Union of Concerned Scientists, but it’s done little so far to pull people back from the coasts and lags behind states such as New Jersey, North Carolina and Texas. Across the country, the effort is still more theory than practice, even as a consensus among planners grows that “managed retreat” may be the best of bad options.

This year, HUD made available $16 billion for climate resilience, its first dedicated fund to fortify for future storms. Nine states, plus Puerto Rico and the Virgin Islands, will decide how to use it, whether to build sea walls, put houses on stilts or move people out of the way. The money is a fraction of what’s needed, and the process is moving at the speed of government.

A study by the Natural Resources Defense Council this month found that buyouts by the Federal Emergency Management Agency, which responds to disasters, take five years on average to be completed. By that time, many homeowners have rebuilt or moved. Similar data isn’t available on the grants from HUD, which also provides money to demolish homes.

“It’s a slow-motion emergency,” said Rob Moore, director of NRDC’s water and climate team. “But it’s happening right now. These last three hurricane seasons show us what it kind of looks like.”

A FEMA spokesman said the agency supports the  voluntary acquisition of flood-prone structures and provides the grant funding, but the prioritization of projects happens at the local level first and then by the state acting as the recipient. The agency believes each county floodplain manager and local official knows the needs of their communities best and are responsible for land usage and permitting.

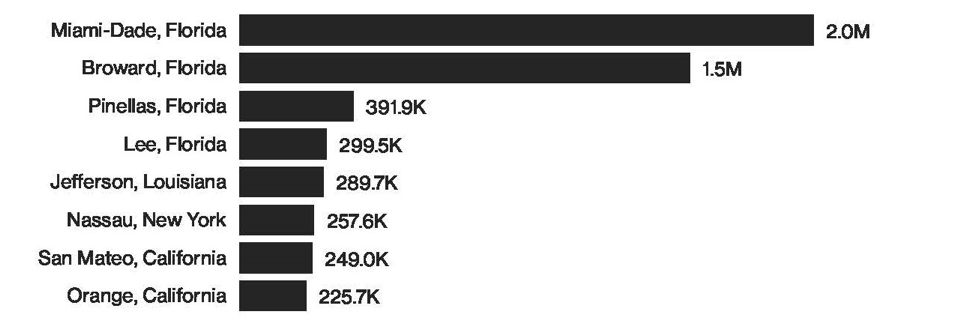
About 6 million Floridians will need to move inland by century’s end to avoid inundation, according to Hauer, the demographer, in a 2016 paper. By then, about 80% of the nearby Keys, the archipelago that includes the tourist mecca of Key West, will be underwater. About 3.5 million people would be flooded in South Florida’s Miami-Dade and Broward, the two counties with America’s biggest exposed populations.

“Florida’s doing it at a really small scale,” said A.R. Siders, an assistant professor at the University of Delaware who studies climate adaptation. “Compared with the new housing units going up in South Florida, I don’t know if that would even cancel out.”

Here Comes the Flood

Number of people at risk by county from a sea level rise of 1.8 meters

Florida State University demographer Matt Hauer

Florida State University demographer Matt Hauer

But Florida runs on tourism and real estate revenue, and managed retreat is a phrase that makes real estate listing agents nervous. But there’s another Florida housing bubble waiting to pop. The Union of Concerned Scientists warns of a coming housing crash — from Miami to San Mateo, California — on a scale worse than last decade’s foreclosure crisis, caused by climate change — from flooding to heat waves and wildfires.

Cities are only starting to grapple with where to resettle residents, and how to transport communities and hometown identities. And homes on higher ground will also demand higher prices, worsening an affordability crisis.

Fifteen years after Hurricane Katrina, Louisiana is trying to relocate the Native American settlement of about 100 people on the Isle de Jean Charles, a narrow island that lost 98% of its land over the past six decades to climate change. It’s working with a $48 million grant from HUD for buyouts and to help them start anew on a 500-acre sugar cane field 40 miles north that the government will populate with homes and businesses. Importantly, it will be 9 feet above sea level. All but three of about 40 households have signed on.

“They’re starting to scale this up,’’ said Jesse Keenan, a social scientist at Harvard University who also specializes in climate adaptation. “This is about building up institutional knowledge on how to do this.’’

​​​​​​​New Jersey has a $300 million fund for buyouts and has purchased hundreds of houses since Superstorm Sandy in 2012, though like Florida, even more homes have been built on the coast in the meantime. Harris County, Texas — which includes Houston, ravaged by a series of storms including 2017’s Harvey — has done more than 3,000 FEMA buyouts, more than any other county in the U.S., according to NRDC.

In Monroe County, Florida, where Rittel lives, the planning is just beginning. The county has applied for $5 million of the HUD money — the state maximum. Already, about 60 local homeowners have applied, so it will require triage. Senior citizens, families and residents in the riskiest flood zone would get priority, said Assistant County Administrator Christine Hurley.

Rittel isn’t sure how long she can hang on.

Her insurance payout of about $100,000 would cover repairs to the 640-square-foot house. But the county requires that when more than 50% of a home is damaged, that it be completely rebuilt to meet modern storm-resiliency codes and — in her flood zone — on stilts. That would cost at least $200,000, money she doesn’t have.

She dreams of resettling in Key West or Homestead, a safer spot on the Florida mainland.

“I’d like to take the money and run,” Rittel said. “But I’ll have to buy something on stilts. I’m not buying anything on the ground down here ever ever again.”

This story is part of Covering Climate Now, a global collaboration of more than 220 news outlets to highlight climate change.


You have checked all the boxes on your due diligence checklist; but have you assessed the Climate Risk of Your Real Property Investment?

By Paul L. Jones, CPA, May 13, 2019

In his legal commentary posted on April 1, 2019, my colleague, Rick Jones, a partner with Dechert LLP, a leading law firm serving the Commercial Real Estate Debt Market, opened with “I’m finally writing about climate change… not because 97 out of 100 scientists are shouting at us incessantly about the need to do something, but because I am dead certain that there are real and fairly immediate risks associated with the public reaction to the perception or awareness (take your pick) of the climate change risk which will drive regulatory intrusion on both the state and federal level, will drive legislation and moreover, will inform market reaction to lenders, investors, developers and their properties because of their climate change posture or profile.”

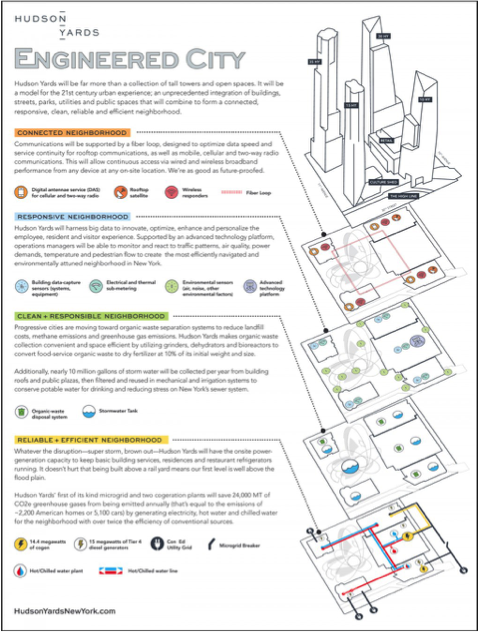
Engineered CItyThe esteemed Mr. Jones continues: “Where do we start?  We are already seeing some commercial real estate owners begin to adapt to regulatory change.  Look at the fantastic engineering marvel which is the Hudson Yards, built 40 feet above sea level, with its storm management system and its fortress-like power system designed to survive a mega storm.  That’s expensive.  It was clearly purpose driven.  We should ask what made them, a bunch of smart folks, put up the money.  I guarantee it wasn’t frivolous.  I would suggest to you that it’s a sign of things to come.  More generally, we are also seeing more solar, more green building technology and more innovations in engineering and in general more willingness to pay real money to address environmental concerns.”

New York has a wet climate, and water – from hurricanes, flooding, storm surges and even blizzards – is one of its primary environmental challenges throughout the year. Of course, buildings in NYC also endure seismic activity, high heat loads in the summer, power outages, manmade disasters like those produced by terrorist attacks as well as high humidity and year-round precipitation.

On the Pacific coast, seismic considerations are a primary concern as well as danger from wildfires, flash floods, and drought.

For most of my career serving the real estate industry, I have primarily conducted due diligence and providing underwriting and financial feasibility analyses for buyers, investors, lenders and capital market participants.

We usually start with a checklist of due diligence and underwriting items which typically includes:

  • reviewing historical operating statements and related reports,
  • abstracting leases and tenant correspondence records,
  • getting a title abstract, checking the flood zone,
  • obtaining and reviewing a property condition assessment (PSA) and a Phase 1 environmental site assessment (ESA), and
  • evaluating all legal and contractual arrangements that may affect the income and expenses of the property.

But, if you are like most real estate investors, you have missed one item which affects all properties and portfolios: the risk resulting from climate change and sea level rise as well as man-made hazards: You still do not know how sustainable and resilient the income and future value from your investment is.

Beginning about five years ago, my clients started to ask questions regarding the potential effect of climate change and sea level rise on the sustainability and resiliency of the property.

  • It is important to note that the risk to real property assets – which are immovable by their nature – exists regardless of whether you believe humans have caused climate change, or not.
  • In fact, my client chose to divest of assets in Miami in order to buy assets in locales without the risk of sea level rise and our screening process involved an informal, yet substantive, assessment of the risk from climate change – no matter the location of the property.

In an article entitled “What does resilience mean for commercial real estate” by Ryan M. Colker published in the September/October issue of BOMA Magazine, he opens with the following observation:

Around the world, the frequency, intensity and impacts of natural disasters are increasing. These events can significantly affect the social, economic and environmental functionality of communities. The ability of commercial buildings and the businesses they house to adequately prepare for such events and quickly return to full operations—a quality known as resilience—contributes significantly to a community’s ability to bounce back. In addition to the community-wide impacts, the state of individual buildings also can affect the long-term viability of the businesses that occupy those buildings.”

For a multi-family, commercial or industrial building, we at Emerald Skyline define building resilience as “the ability of the systems and structure to protect, maintain or restore the value of, functionality of, and income generated by a property after a damaging event or calamity – whether it is from a weather event or a man-made circumstance – within a pre-determined acceptable timeframe.

  • A widely-cited 2005 study by the Multi-hazard Mitigation Council (MMC) of the National Institute of Building Sciences “documented how every $1 spent on mitigation saves society an average of $4.
  • In a 2018 interim update report by the MMC found that costs and benefits of designing all new construction to exceed select provisions in the 2015 IBC and the IRC and the implementation of the 2015 International Wildland-Urban Interface Code (IWUIC) resulted in a national similar benefit of saving $4 in future losses for every $1 spent on additional, up-front construction costs.

In a report published last month (April 2019) by the Urban Land Institute (ULI) and underwritten by Heitman LLC (Heitman) entitled “Climate Risk and Real Estate Decision-making,” the authors note that:

“In 2017, the year Hurricanes Harvey and Maria hit the United States and storms battered northern and central Europe, insurers paid out a record $135 billion globally for damage caused by storms and natural disasters. This figure does not represent actual damages, which in the United States alone equaled $307 billion, according to National Oceanic and Atmospheric Administration estimates.”

In the Foreword, Ed Walter, Global CEO, ULI, and Maury Tognarelli, CEO, Heitman, highlight the need to address sustainability and resiliency:

“Failure to address and mitigate climate risks may result in increased exposure to loss as a result of assets suffering from reduced liquidity and lower income, which will negatively affect investment returns. At the same time, investors who arm themselves with more accurate data on the impact of climate risks could help differentiate themselves and benefit from investing in locations at the forefront of climate mitigation.

And the industry – especially among institutional investors – is taking note. “Many leading investment managers and institutional investors are undertaking flood, resilience, and climate vulnerability scans of their portfolios. These mapping exercises seek to identify the impacts of physical climate risks on their properties, including sea-level rise, flooding, heavy rainfall, water stress, extreme heat, wildfire, and hurricanes. Potential impacts being considered range from physical access and business disruption for tenants to the effects that longer-term temperature increases or increased wear and tear on buildings could have on operating and capital expenditure requirements. The ultimate objective for the investment community is to understand how climate will affect asset liquidity and, as a result, returns, in terms of both income and capital growth.”

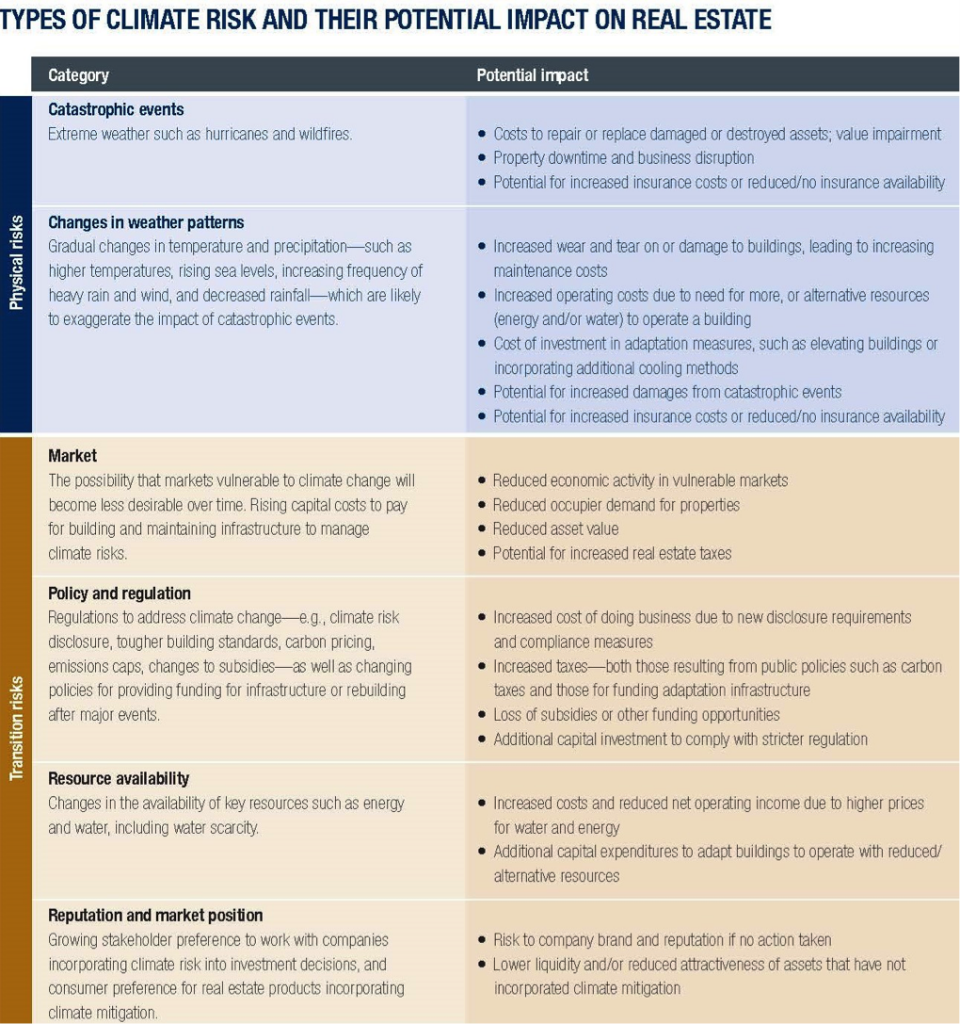
The results of the survey conducted in preparation of this report, the researchers found that industry participants continue to rely on insurance companies to cover potential losses from physical damage due to a natural disaster – but they astutely point out that insurance “does not protect investors from devaluation or a reduction in asset liquidity.” They categorize the climate risks either physical or transitional risks as follows:

  • “Physical risks are those capable of directly affecting buildings; they include extreme weather events, gradual sea-level rise, and changing weather patterns.
  • “Transition risks are those that result from a shift to a lower-carbon economy and using new, non-fossil-fuel sources of energy. These include regulatory changes, economic shifts, and the changing availability and price of resources.

“The location-specific physical threats posed by factors such as sea-level rise, hurricanes, wildfires and forest fires, heat stress, and water stress are among the most easily observable risks to real estate investment. They are a particular concern since many key markets for real estate investment are in areas exposed to the physical impacts of climate change.

These risks and their potential impact on real estate is summarized in the following table.

types of risk

So far, according to the ULI report, “…most investment managers and investors for directly held assets currently use insurance as their primary means of protection against extreme weather and climate events.” However, “leading companies in the industry … are modifying existing decision-making and management processes to add climate and extreme weather-related factors to those being considered alongside other risks and opportunities.

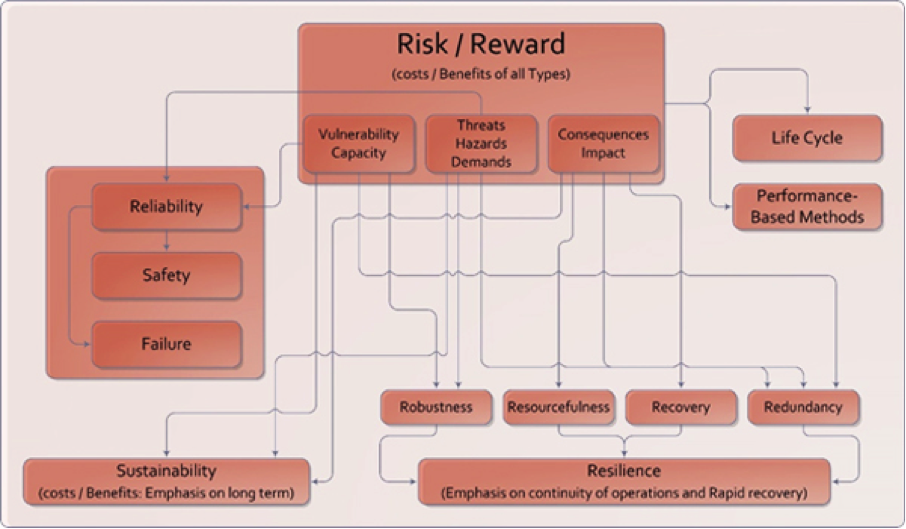
The National Infrastructure Advisory Council (NIAC) in a 2009 repot characterized resilience as having four key features known as the “4-Rs”:

  • Robustness: the ability to maintain critical operations and functions in the face of crisis.
  • Resourcefulness: the ability to skillfully prepare for, respond to and manage a crisis or disruption as it unfolds.
  • Rapid recovery: the ability to return to and/or reconstitute normal operations as quickly and efficiently as possible after a disruption.
  • Redundancy, back-up resources to support the originals in case of failure that should also be considered when planning for resilience

From the Whole Building Design Guide, a program of the National Institute of Building Sciences (NIBS), understanding the relationship between Asset (Building) resilience and the community’s resilience requires an understanding of the distinctions and relationships between risk, resilience and sustainability as follows:

  • Risk is expressed as the relationship between a particular hazard or threat that may degrade, or worse, devastate, the building’s security, operations and functionality and the consequences that result from this degradation of performance.
  • Resilience is the ability of a building or asset to recover from, or adjust, easily to misfortune or change. The ability to prepare and plan for, absorb, recover from, or more successfully adapt to actual or potential adverse effects as reflected in the aforementioned Four Rs.
  • Sustainability of an asset is determined by its ability to meet the needs of the present while being able to maintain its functionality over time without not being harmful to the environment or depleting natural resources.

The following diagram created by Mohammed Ettouney and Sreenivas Alampalli in their books on Infrastructure Health in Civil Engineering, presented the relationship of threat, vulnerability and consequences to risk as follows:

riskreward

Recognizing the need for sustainability and resiliency due diligence, Emerald Skyline Corporation has developed a Sustainability and Resiliency Assessment (SaRA Rating©) Rating system to provide commercial real estate investors with a complete picture of the risk associated with a particular property or investment. The information not only helps investors and owners but also provides lenders, insurers and tenants with information relevant to their decisions.

SaRA Rating© incorporates an assessment of the physical attributes of the property – including incorporation of information obtained from traditional due diligence procedures with additional procedures to determine the relative risk, resiliency and sustainability of the property over the investment horizon.

  • The physical review of the property is conducted in conjunction with the Phase I environmental site assessment and the property condition assessment and includes a review of the property’s resiliency features like hardened walls, raised electronic and network connections, secondary systems.

No building operates in a vacuum: Its resiliency, in particular, is directly connected to its location and is directly affected by the surrounding neighborhood, the community, and natural and man-made risks (hazards).

Based on a property-specific assessment including use of mapping services, our team of professionals evaluate a building’s resiliency and sustainability resulting in a rating from 1, not resilient or sustainable (High Risk) to a 5 (Highly Resilient). Our objective is to provide investors with the information they need to make prudent investment decisions that account for the physical, environmental and social risks to the cash flow stream and market value of the building.

At the conclusion of our procedures, we identify land and building improvements that would enhance a property’s resiliency and sustainability. The economics of each improvement or enhancement is assessed in a cost-benefit analysis.

We then evaluate the tradeoffs between performance of a building over its life-cycle and the cost of improving the building systems to ensure its sustainability and resiliency. Accordingly, we evaluate the total cost of ownership (TCO) by determining the capital cost of the property including any improvements plus the present value of the future expenses of operations, maintenance, utilities and the estimated cost to recover from a calamity.

Further, armed with the SaRA Rating© and report, the stakeholders can incorporate current and prospective tenant/user demand for the space in the building given the cost of occupancy and resiliency as well as investor demand and potential pricing for the asset. A resilient and sustainable asset will combine low-cost operations due to sustainably-reduced energy and maintenance costs and managed insurance expenses while maximizing the net cash flow and long-term value of the property.

The objective of all due diligence – including and especially the assessment of all the risks of ownership – is to optimize the overall returns on the investment while quantifying and minimizing the risks and costs to achieve those goals – that is the purpose of Emerald Skyline’s Sustainability and Resiliency Assessment Rating© system – your one-stop resource to measure and manage climate risk in the real estate industry.

For more information, contact Paul L. Jones, CPA, Phone: 786-468-9414; email: [email protected]

C-PACE Flips The Script On Energy Efficiency For Multi-Tenant Commercial Properties

By Counterpointe Energy Solutions
You can view the original article here.

Screen Shot 2018-12-14 at 10.47.12 AM

Historically, making energy efficiency improvements to buildings has been uneconomic for owners of commercial real estate. There are structural reasons why leased commercial properties have traditionally lagged all other properties types in terms of energy efficiency. The results? Billions of dollars of inefficiencies, hurting the environment as well as most companies bottom lines. “Energy use in buildings is a $400bn to $500bn a year problem,” according to Stephen Selkowitz of the Lawrence Berkeley National Laboratory. Worse, tenants are inhabiting buildings with outdated infrastructure for seemingly no reason. These problems are well-understood, and the solutions are readily available, so what is holding commercial properties back?

THE SPLIT INCENTIVE

Common types of commercial leases, such as triple net or modified gross leases, make tenants responsible for energy bills. As a result, the benefits of any reductions in operating costs from energy efficiency upgrades accrue to tenants. As great as that is for the tenant, it leaves the property owner holding the bag and bearing the total cost of those capital improvements. So not surprisingly, property owners have virtually no reason to invest in improvements. They utilize equity for no return. This conundrum is known as “the split incentive”. Given this raw deal, it is no wonder that property owners have been reluctant to engage in energy efficiency projects.

PACE IS THE SOLUTION

Enter Commercial Property Assessed Clean Energy (C-PACE), an innovative financing option that can be used to finance 100% of renewable energy, energy efficiency and resiliency improvements to commercial properties. PACE financing also covers all development and soft costs, so there are no out-of-pocket expenses for the property owner. C-PACE solves the split incentive problem and uses the commercial lease structure to the owner’s advantage. Since it is an assessment, not a loan, C-PACE payments are paid with property taxes. And in most triple net and modified gross leases, tenants pay their share of property taxes. So now, the tenant who benefits from the upgrade is also responsible for repayment – thereby solving the split incentive problem.
For property owners, C-PACE is a definite win. They get to upgrade their assets, with no out-of-pocket expenses. The improved properties have lower energy bills, resulting in lower operating expenditures and higher valuations. The properties can also be marketed as “green”, allowing owners to take advantage of any rent premiums for environmentally friendly buildings, as well as better cap rates upon sale

Recently upgraded buildings are also an added selling point when attracting new tenants and buyers. For example, the World Green Building Council reported in 2016 that greener retail buildings correlate with happier customers and higher revenues for stores. When it comes time to find new tenants or renegotiate terms of a lease, property owners will benefit handily from having made a C-PACE assessment.

Tenants also benefit from C-PACE. Most C-PACE programs require energy efficiency improvements to have a savings-to-investment ratio greater than one. This means that tenants should be able to make each C-PACE repayment with only the funds they have saved from lower energy bills – and still have cash left over that they can pocket. Tenants additionally get to inhabit improved buildings with brand new HVAC, windows, chillers, and other features.

The community likewise benefits from the environmental impact of C-PACE. Energy efficiency reduces the emissions of greenhouse gases, minimizing smog and asthma-inducing particles and diminishes the need for environmentally disruptive fossil fuel extraction methods.
Energy efficiency has long been a difficult investment for owners of commercial real estate. C-PACE flips this script – energy efficiency projects are now not only a good idea but are a slam dunk for commercial property owners.

Don’t Confuse the Causes and Solutions of Climate Change with Sea Level Rise

By John Englander
View the original article here.

With the growing awareness of the threat from rising seas, there is a fundamental point of confusion. It is widely believed that “green projects,” energy efficiency, and better public transportation can “solve sea-level rise.”

This popular notion is even showing up in candidates’ platforms for the upcoming election. It is simply wrong.

The warming of the planet, now about 1.5 degrees Fahrenheit over the last century and headed for at least double that level, correlates with increased carbon dioxide levels in the atmosphere from fossil fuel use — the so-called greenhouse effect. Even the controversial 2015 Paris Climate Agreement only aims to keep the temperature rise to 50 percent further warming, and recognizes we are not instituting the changes to reach even that modest goal.

Efforts to slow and reverse that warming should be our highest priority. Those efforts should focus on reducing energy consumption and switching to renewable sources, such as solar energy. Improved mass transit, electric vehicles, and more use of bicycles are all efforts that will contribute to slow the warming.

Also, developing technology to remove carbon from the atmosphere or lock carbon in plant matter — trees, the Everglades and even algae — can help reduce the warming atmosphere. But none of those efforts can soon stop sea-level rise.

Rising sea level is primarily caused by the melting of the ice sheets on Greenland and Antarctica, which is happening at an accelerating rate because of the extraordinary heat alreadystored in the oceans. The oceans also expand slightly as they continue to warmThose two causes of rising sea level cannot be stopped in the next few decades, even if the entire world could magically switch to 100 percent solar energy right now.

Our oceans, atmosphere, and planet have gotten warmer primarily because the heat-trapping CO2 (carbon dioxide) level is now 410 PPM (Parts per million), 40 percent higher than any time in the last 10 million years.

That greater atmospheric insulation adds heat to the sea equivalent to four nuclear bombs every second of every day. Like a giant outdoor swimming pool, the ocean retains heat even if the air temperature cools. That extra ocean heat will continue to affect our weather and melt glaciers for many decades, even if we can slow the warming.

The latest projections from International and national science organizations and the Southeast Florida Regional Climate Change Compactsay that we need to plan for a few feet of higher sea level by mid-century and as much as 6 to 8 feet by the end of the century.

Thus, it is imperative that we now separate three quite distinct problems and solutions. A solution to one will not soon have any effect on the other two.

  1. Reduce emission of greenhouse gases and even remove them from the atmosphere. SOLUTIONS: Energy conservation, switch to renewable energy sources, improve public transportation, promote bicycle use, plant trees and develop affordable technologies to take carbon dioxide out of the atmosphere.
  2. Prepare for extreme weather events. More heat in the oceans and atmosphere produces stronger storms, more rainfall, droughts, and wildfires. SOLUTIONS: Buildings, infrastructure, and building codes should be designed to accommodate periodic flooding, improve drainage, use less energy, etc.
  3. Adapt for rising sea level:  Higher sea level will change coastlines and marshlands all over the world and means ever increasing high tides and worse temporary flooding from storms, rainfall and runoff. SOLUTIONS: Elevate buildings and infrastructure (better building codes), install temporary flood barriers for extreme events, and ultimately, accept that coastlines will change.

Our futures require that we design and implement personal, community, and governmental policies to respond to these three threats: elevated greenhouse gases, extreme weather events, and sea level rising ever-higher.

It is great to see that politicians, the public, and professionals are developing greater concern for climate change and rising sea level. Recognizing that these three challenges demand separate solutions is the only smart path forward — and upwards.


John Englander is an oceanographer and author of “High Tide On Main Street.”  He is also President of The International Sea Level Institute, a new nonprofit think tank and policy center. His weekly blog and news digest can be found at www.sealevelrisenow.com

 “The Invading Sea” is a collaboration of four South Florida media organizations — the South Florida Sun Sentinel, Miami Herald, Palm Beach Post and WLRN Public Media.


In-depth Q&A: The IPCC’s special report on climate change at 1.5C

The original article was written by the Carbon Brief Staff on 8/10/18. You can view it here.

Earlier today in South Korea, the Intergovernmental Panel on Climate Change (IPCC) published its long-awaited special report on 1.5C.

The IPCC is a body of scientists and economists – first convened by the United Nations (UN) in 1988 – which periodically produces summaries of the “scientific basis of climate change, its impacts and future risks, and options for adaptation and mitigation”.

The reports are produced, in the first instance, to inform the world’s policymakers.

In this detailed Q&A, Carbon Brief explains why the IPCC was asked to produce a report focused on 1.5C of global warming, what the report says and what the reaction has been…

Why did the IPCC produce this special report?

For many years, limiting global warming to no more than 2C above pre-industrial levels was the de-facto target for global policymakers. This was formalised when countries signed the Cancun Agreements at the UN’s climate conference in Mexico in 2010.

However, at the climate talks in Bonn in May 2015, the UN published a new report that warned that the 2C limit was not adequate for avoiding some of the more severe impacts of climate change.

The report – a product of a two-year “structured expert dialogue” (SED) involving more than 70 scientists – found that 2C of warming was not a “guardrail up to which all would be safe”. Instead, it recommended that while “science on the 1.5C warming limit is less robust, efforts should be made to push the defence line as low as possible”.

The findings of the SED subsequently fed into the working draft that would form the Paris Agreement. In December 2015, 195 countries endorsed the agreement, which backed a long-term goal to limit global temperature rise to “well below 2C” and to “pursue efforts towards 1.5C”.

As part of the text of the agreement, the UN Convention on Climate Change (UNFCCC) “invited” the IPCC “to provide a special report in 2018 on the impacts of global warming of 1.5C above pre-industrial levels and related global greenhouse gas emission pathways”.

The IPCC accepted this invitation following a meeting in Nairobi in April 2016 and then drafted an outline of the report at their Geneva gathering in August of the same year. This outline was rubber-stamped two months later at a meeting in Bangkok.
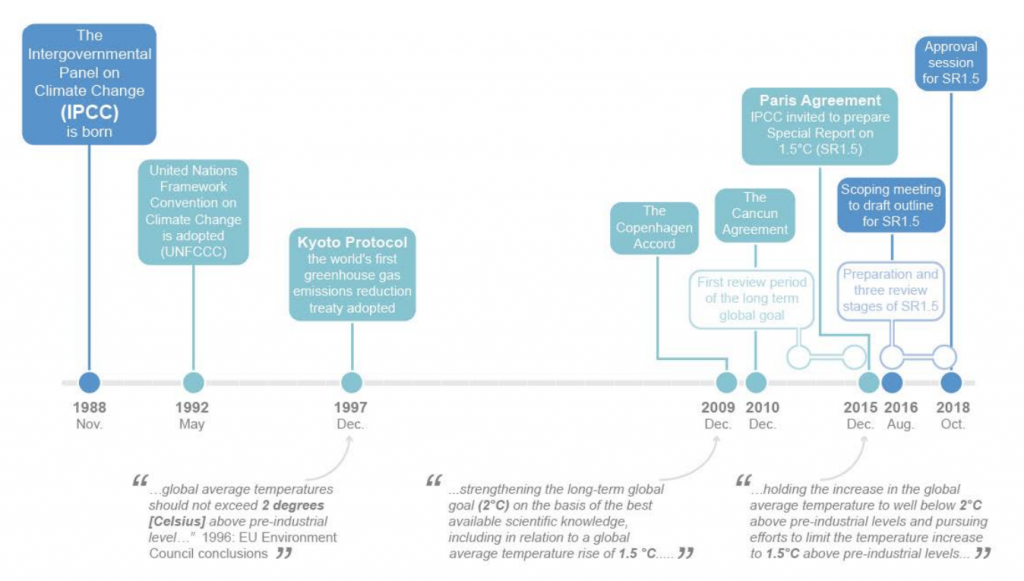
A timeline of notable dates in preparing the 1.5C special report (shaded blue) embedded within processes and milestones of the UNFCCC (grey). Credit: IPCC (pdf)

A timeline of notable dates in preparing the 1.5C special report (shaded blue) embedded within processes and milestones of the UNFCCC (grey). Credit: IPCC (pdf)

The author team (pdf) for the report – including review editors – was made up of 91 scientists and policy experts drawn from 44 nationalities. The country most represented was the US with seven authors, followed by Germany with six and the UK with five.

The report, published today following a week-long meeting in Incheon in South Korea, draws on scientific literature from across all three of the IPCC’s “working groups”. However, the authoring was led by the technical support unit of the IPCC’s Working Group I (WG1), which focuses on assessing the physical scientific basis of the climate system and climate change.

The report writing process began with a first author meeting in Sao José dos Campos, Brazil, in March 2017. Three author meetings, three report drafts and 42,000 reviewer comments later, the final report was submitted.

The report has two main parts: a full technical report and a short summary for policymakers (SPM). The wording of the latter was agreed line-by-line by government delegates last week in Incheon. Following the approval of the SPM, there are some updates that need to be made to the full report to ensure it is consistent with the revised SPM. These have not been yet made and so the individual chapters are subject to changes listed in the “trickle-back” document (pdf).

How far away is 1.5C of warming?

Global average temperatures have already warmed by around 1C since pre-industrial times (taken as 1850-1900 by the IPCC). However, the rate of warming is not consistent across the Earth’s surface, as the SPM notes:

“Warming greater than the global annual average is being experienced in many land regions and seasons, including two to three times higher in the Arctic. Warming is generally higher over land than over the ocean.”

In fact, chapter one (pdf) of the report notes that 20-40% of the global population live in regions that have already experienced warming of more than 1.5C in at least one season.

This is illustrated in a group of maps found in the same chapter, which show regional warming (in 2006-15) as an annual average and for the winter and summer seasons. The red and purple shading highlights that much of the high latitudes in the northern hemisphere have already exceeded the 1.5C of warming.
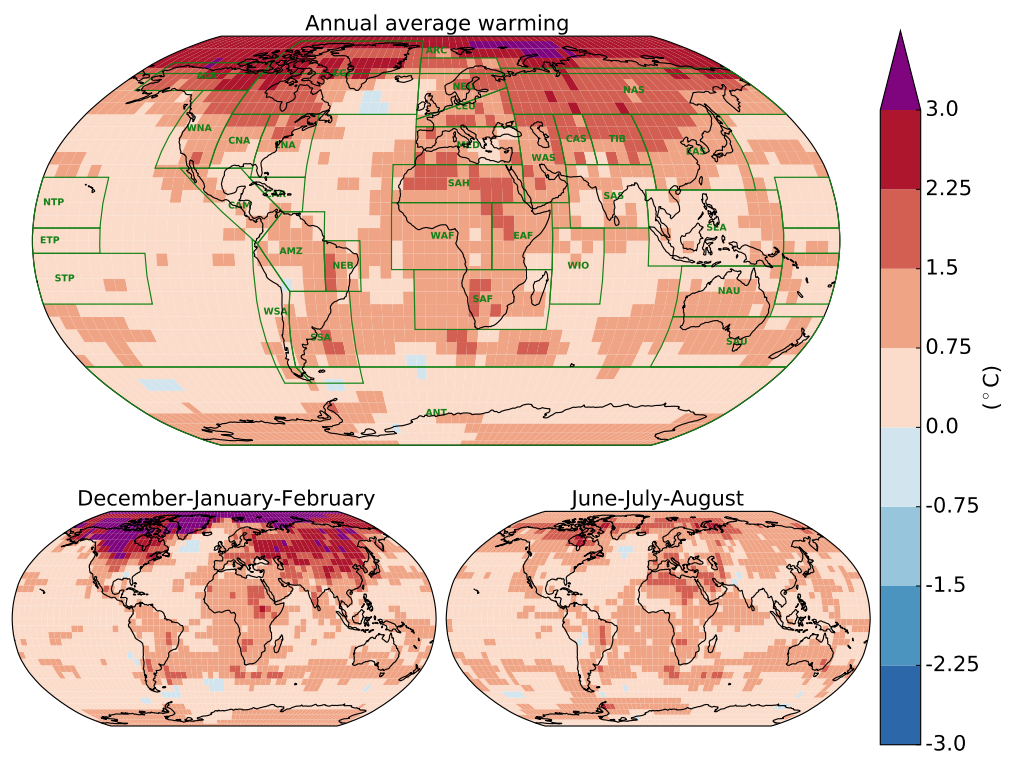
Maps of regional human-caused warming for 2006-15, relative to 1850-1900, annual average (top), the average of December, January and February (bottom left) and for June, July and August (bottom right). Shading indicates warming (red and purple) and cooling (blue). Credit: IPCC (pdf)

Maps of regional human-caused warming for 2006-15, relative to 1850-1900, annual average (top), the average of December, January and February (bottom left) and for June, July and August (bottom right). Shading indicates warming (red and purple) and cooling (blue). Credit: IPCC (pdf)

Around 100% of this warming is the result of human activity, the SPM says:

“Estimated anthropogenic global warming matches the level of observed warming to within ±20%.”

At current rates, human-caused warming is adding around 0.2C to global average temperatures every decade. This is the result of both “past and ongoing emissions”, the report notes.

If this rate continues, the report projects that global average warming “is likely to reach 1.5C between 2030 and 2052”.

Note that this is not referring to the first time that global average temperatures in a single year hit 1.5C above pre-industrial levels. Natural influences in the global climate – such as variability in the oceans – could temporarily tip temperatures beyond the 1.5C limit. (Similarly, factors such as a large volcanic eruption could suppress global temperatures in the short term.) What the special report is referring to is the point where long-term, human-caused warming reaches 1.5C, with these natural influences taken out.

This is illustrated in the chart from the SPM below, which shows global temperatures, relative to pre-industrial levels. The black line shows the fluctuations of global monthly temperatures to date, which includes the influence of natural variability. The red line shows the estimate of human-caused warming, which shows a more gradual increase. The grey, blue and purple shading illustrate different pathways to keeping warming to no more than 1.5C in 2100.
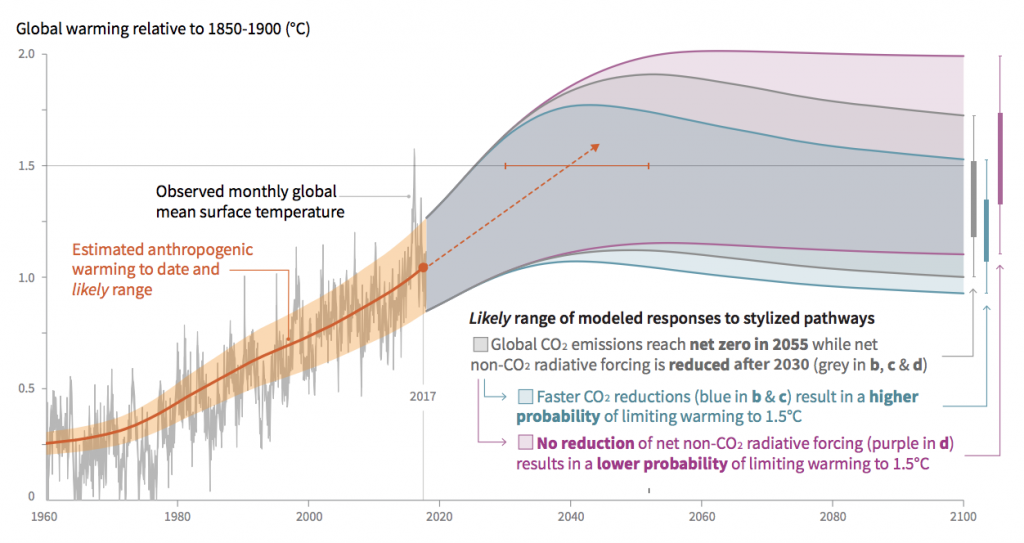
 

Chart shows observed monthly temperatures (black line), estimated human-caused warming (red), and idealised potential pathways to meeting 1.5C limit in 2100 (grey, blue and purple). All relative to 1850-1900. Credit: IPCC (pdf)

Chart shows observed monthly temperatures (black line), estimated human-caused warming (red), and idealised potential pathways to meeting 1.5C limit in 2100 (grey, blue and purple). All relative to 1850-1900. Credit: IPCC (pdf)

Past greenhouse gas emissions are unlikely to be enough by themselves to push global warming from 1C to 1.5C in the coming decades, the report notes, meaning that if emissions stopped today, the 1.5C limit would not be breached.

However, at the same time, the global emissions to date “will persist for centuries to millennia”, the report says, “and will continue to cause further long-term changes in the climate system, such as sea level rise, with associated impacts”.

(To see how every part of the world has already warmed – and could continue to warm under a range of different scenarios  – see Carbon Brief’s new searchable map.)

 How do the impacts of climate change compare between 1.5C and 2C?

Since the inclusion of the 1.5C limit in the Paris Agreement, there has been something of a flurry of research into the impacts of 1.5C of warming on the planet.

In fact, as Prof Piers Forster – professor of physical climate change at the University of Leeds and a lead author on chapter two of the special report – wrote in a Carbon Brief guest post at the end of the Paris talks, “climate scientists were caught napping” by the 1.5C limit:

“Before Paris, we all thought 2C was a near-impossible target and spent our energies researching future worlds where temperatures soared. In fact, there is still much to discover about the specific advantages of limiting warming to 1.5C.”

In a recent interactive article, Carbon Brief presented the findings of around 70 peer-reviewed studies showing how the potential impacts of climate change compare at 1.5C, 2C and beyond. The data covers a range of impacts – such as sea level rise, crop yields, biodiversity, drought, economy and health – for the world as a whole, as well as specific regions.

In the special report on 1.5C, chapter one (pdf) notes that climate impacts are already being observed on land and ocean ecosystems, and the services they provide:

“Temperature rise to date has already resulted in profound alterations to human and natural systems, bringing increases in some types of extreme weather, droughts, floods, sea level rise and biodiversity loss, and causing unprecedented risks to vulnerable persons and populations.”

The people that have been most affected live in low- and middle-income countries, the report says, some of whom have already seen a “decline in food security, linked in turn to rising migration and poverty”. Small islands, megacities, coastal regions and high mountain ranges are also among the most affected, the report adds.

In general – and, perhaps, unsurprisingly – the potential impacts of global warming “for natural and human systems are higher for global warming of 1.5C than at present, but lower than at 2C”, the SPM says. The risk are also greater if global temperatures overshoot 1.5C and come back down rather than if warming “gradually stabilises at 1.5C”.

There are a lot of impacts to consider, which is reflected in the fact that chapter three(pdf) on impacts is the longest of the whole report at 246 pages.

In many cases, the IPCC has “high confidence” that there is a “robust difference” between impacts at 1.5C and 2C – such as average temperature, frequency of hot extremes, heavy rainfall in some regions and the probability of drought in some areas.

As an illustration, the report includes a “reasons for concern” graphic that shows how the risks of severe impacts varies with warming levels. The example below shows a section of this graphic showing some of these impacts. The coloured shading indicates the risk level, from “undetectable” (white) up to “very high” (purple).

The graphic shows how warm water corals and the Arctic are particularly at risk from rising temperatures, moving into the “very high” category with 1.5C and 2C of warming, respectively.

How the level of global warming affects impacts and/or risks associated for selected natural, managed and human systems. Adapted from IPCC (pdf)

How the level of global warming affects impacts and/or risks associated for selected natural, managed and human systems. Adapted from IPCC (pdf)

Tropical coral reefs actually get their own specific section in Box 3.4 in chapter three, which emphasises that at 2C of warming, coral reefs “mostly disappear”. However, even achieving 1.5C “will result in the further loss of 90% of reef-building corals compared to today”, the report warns. And short periods (i.e. decades) where global temperatures overshoot 1.5C before falling again “will be very challenging to coral reefs”.

For the Arctic, the report expects that “there will be at least one sea-ice free Arctic summer out of 10 years for warming at 2C, with the frequency decreasing to one sea-ice-free Arctic summer every 100 years at 1.5C”. Interestingly, the report also notes that overshooting 1.5C and coming back down again would “have no long-term consequences for Arctic sea-ice coverage”.

Warming of 1.5C will also see weather extremes become more prevalent across the world, the report says. Increases in hot extremes are projected to be largest in central and eastern North America, central and southern Europe, the Mediterranean region, western and central Asia, and southern Africa. Holding warming to 1.5C rather than 2C will see around 420 million fewer people being frequently exposed to extreme heatwaves, the report notes.

High and low extremes in rainfall are also expected to become more frequent, the report says. The largest increases in heavy rainfall events are expected in high-latitude regions, such as Alaska, Canada, Greenland, Iceland, northern Europe and northern Asia. Whereas in the Mediterranean region and southern Africa, for example, “increases in drought frequency and magnitude are substantially larger at 2C than at 1.5C”.

For global sea levels, increases are projected to be around 0.1m less at 1.5C than at 2C come the end of the century, the report notes, which would mean that “up to 10.4 million fewer people are exposed to the impacts of sea level globally”. However, sea levels will continue to rise beyond 2100, the report says, and there is a risk that instabilities in the Greenland and Antarctic ice sheets triggered by 1.5–2C of warming cause “multi-metre” increases in sea levels in the centuries and millennia to come.

Sea level rise is particularly pertinent for the risks facing small island states, which are covered in Box 3.5. The combination of rising seas, larger waves and increasing aridity“might leave several atoll islands uninhabitable” under 1.5C, the report warns.

Another topic given its own specific box is food security (“Cross-Chapter Box 6”), which is affected in various different ways by climate change, the report says:

“Overall, food security is expected to be reduced at 2C warming compared to 1.5C warming, due to projected impacts of climate change and extreme weather on crop nutrient content and yields, livestock, fisheries and aquaculture, and land use (cover type and management).”

Climate change can exacerbate malnutrition by reducing nutrient availability and quality of food products, the report notes. However, in general, “vulnerability to decreases in water and food availability is reduced at 1.5C versus 2C, whilst at 2C these are expected to be exacerbated, especially in regions such as the African Sahel, the Mediterranean, central Europe, the Amazon, and western and southern Africa”.

How quickly do emissions need to fall to meet the 1.5C limit?

Not all 1.5C limits are made equal. In model simulations that translate emissions into atmospheric greenhouse gas concentrations – and, ultimately, to future warming – different emissions pathways take different routes to staying below 1.5C in 2100.

The special report broadly separates these pathways into two categories, as the Frequency Asked Questions section (pdf) of the report explains:

“The first involves global temperature stabilising at or below before 1.5C above pre-industrial levels. The second pathway sees warming exceed 1.5C around mid-century, remain above 1.5C for a maximum duration of a few decades, and return to below 1.5C before 2100. The latter is often referred to as an ‘overshoot’ pathway.”

The charts below illustrate the difference, with an “overshoot” pathway on the left and a stabilisation pathway on the right.
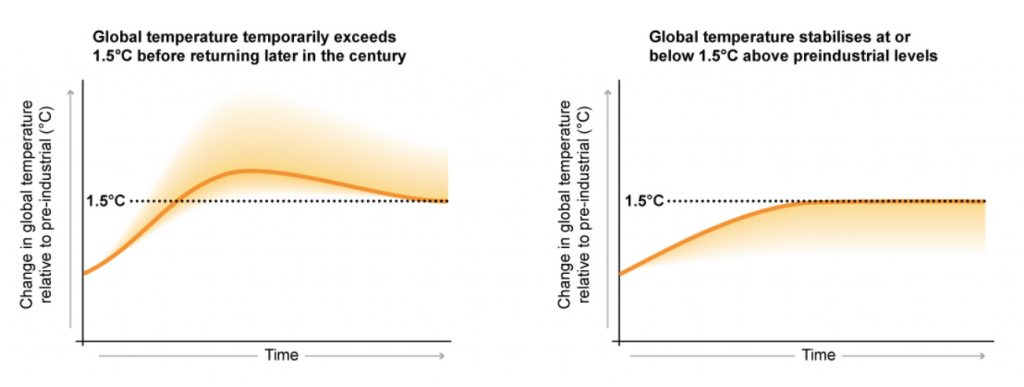
Two main pathways for limiting global temperature rise to 1.5C: stabilising warming at, or just below, 1.5C (right) and warming temporarily exceeding 1.5C before coming back down later in the century (left). Credit: IPCC (pdf)

Two main pathways for limiting global temperature rise to 1.5C: stabilising warming at, or just below, 1.5C (right) and warming temporarily exceeding 1.5C before coming back down later in the century (left). Credit: IPCC (pdf)

Below, as the table from chapter two (pdf) shows, the emissions scenarios used in the report fall into different categories, according to how much they overshoot 1.5C. Notably, only nine of the 90 1.5C scenarios stay below 1.5C for the entire 21st century. The other 81 all overshoot at some point.

This issue led the European Union to reportedly argue last week that overshoot scenarios should not count as aligned with the Paris Agreement’s 1.5C limit.
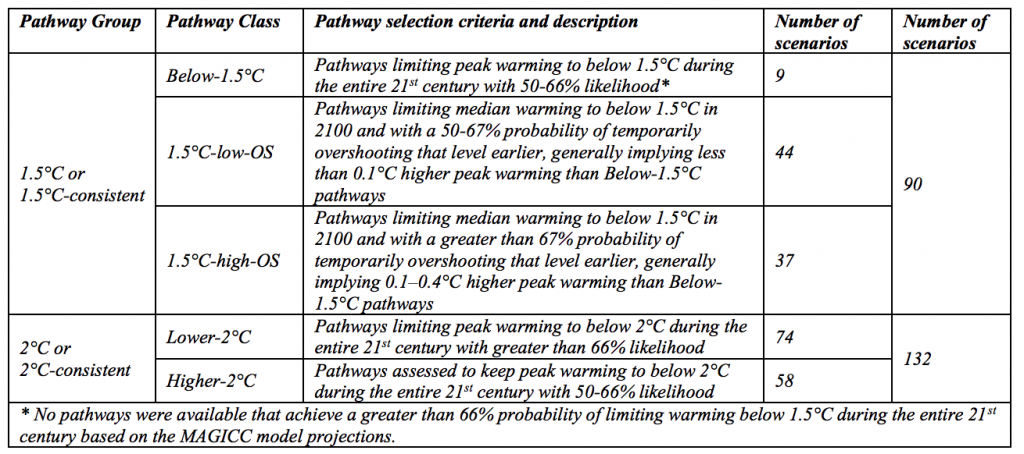
 

IPCC5

According to the SPM, in order to limit warming to 1.5C with “no or limited overshoot”, net global CO2 emissions need to fall by about 45% from 2010 levels by 2030 and reach “net zero” by around 2050.

In other words, by the middle of this century, the CO2 emitted by human activities needs to be matched by the CO2 deliberately taken out of the atmosphere through negative emissions techniques, such as afforestation and bioenergy with carbon capture and storage (BECCS).

For 2C, CO2 emissions will need to decline by about 20% by 2030 and reach net zero around 2075.

Both the 1.5C and 2C limits would also need similar “deep reductions” in non-CO2 emissions, such as methane and nitrous oxide, the SPM adds.

The graphic below illustrates how steeply CO2 emissions (left) and non-CO2 emissions (right) need to fall for 1.5C. The blue lines and shading show examples of pathways that meet the 1.5C limit with little (0-0.2C) or no overshoot, while the grey shows those where temperatures have a “high” temporary overshoot before coming back down again.

The requirement to reach net zero by 2050 is the same for future pathways with and without overshoot, chapter two notes.
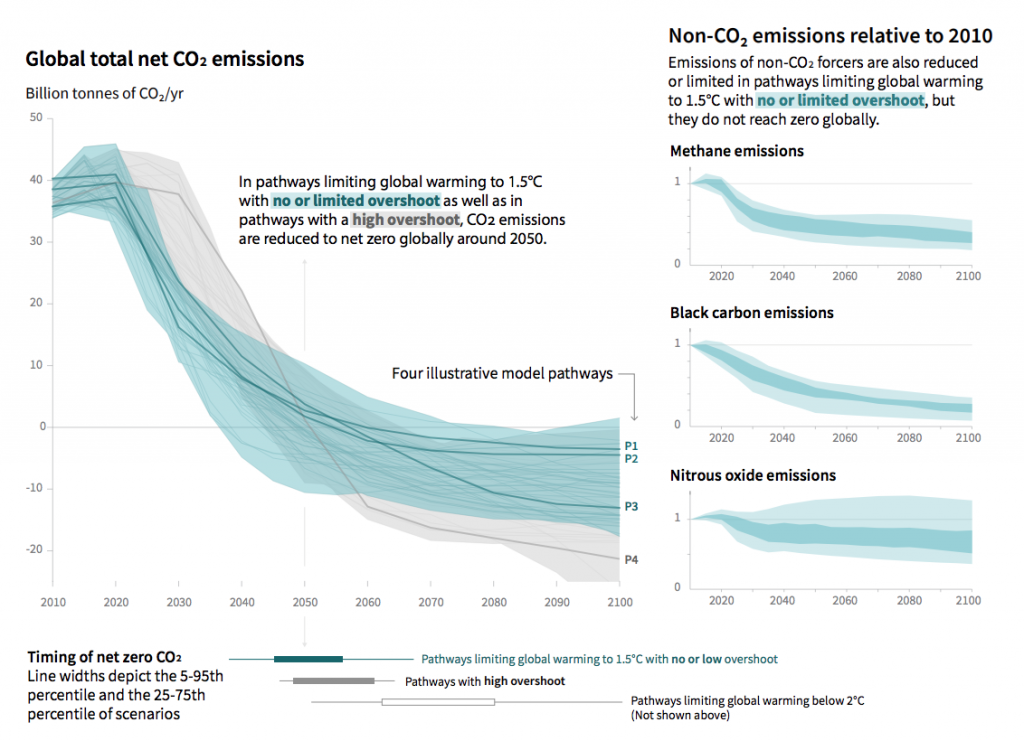
Illustration of the timings of net zero for CO2 for meeting the 1.5C limit under “no or limited overshoot” (blue) and “high overshoot” (grey) scenarios. Also shown are emissions reductions required for methane, black carbon and nitrous oxide (right). Credit: IPCC (pdf)

Illustration of the timings of net zero for CO2 for meeting the 1.5C limit under “no or limited overshoot” (blue) and “high overshoot” (grey) scenarios. Also shown are emissions reductions required for methane, black carbon and nitrous oxide (right). Credit: IPCC (pdf)

So, how do current ambitions to cut emissions compare with these targets?

As part of the Paris Agreement, individual countries and the EU submitted pledges to reduce their emissions, known as “Nationally Determined Contributions”, or “NDCs”. These commitments run up to 2025 or 2030, with the intention that ambition is “ratcheted up” through the century.

However, as they stand, the cumulative emissions reductions are some way off the pathway to 1.5C, says chapter two:

“Under emissions in line with current pledges under the Paris Agreement, global warming is expected to surpass 1.5C, even if they are supplemented with very challenging increases in the scale and ambition of mitigation after 2030.”

Essentially, following such a relatively slow pace of emissions cuts for the next decade or so would would mean emissions need to drop to net zero even earlier – by 2045. And even if that were achieved, holding warming to 1.5C would still not be guaranteed.

As an FAQ from chapter two concludes:

“With the national pledges as they stand, warming would exceed 1.5C, at least for a period of time, and practices and technologies that remove CO2 from the atmosphere at a global scale would be required to return warming to 1.5C at a later date.”

What would it take to limit warming to 1.5C?

Cutting emissions to meet a 1.5C limit would require “rapid and far-reaching transitions” across the global economy, the SPM says.

These transitions would need to transform the way energy is used and the sources it comes from; the way land use and agricultural systems are organised; and the types and quantities of food and material that are consumed. The summary continues:

“These systems transitions are unprecedented in terms of scale, but not necessarily in terms of speed, and imply deep emissions reductions in all sectors, a wide portfolio of mitigation options and a significant upscaling of investments in those options.”

The details of these transformations are set out in more detail in the 113-page chapter two (pdf) of the report and a 99-page technical annex (pdf), based on research using integrated assessment models (IAMs). These IAMs combine different strands of knowledge to explore how human development and societal choices interact with and affect the natural world.

(See Carbon Brief’s in-depth explainer on IAMs for more on what they are and the ways they are limited.)

One “key finding”, says chapter two of the report, is that there are many different ways to meet the 1.5C limit under a wide spread of assumptions about future human and economic development. These pathways reflect different futures in terms of global politics and societal preferences, implying different trade-offs and co-benefits for sustainable development and other priorities.

However, all 1.5C pathways share certain features, including CO2 emissions falling to net-zero and unabated coal use being largely phased out by mid-century. They also include renewables meeting the majority of future electricity supplies, with energy use being electrified and made more efficient.

Investment in unabated coal is “halted” by 2030 in “most” 1.5C pathways, says chapter two. It adds:

“Some fossil investments made over the next few years – or those made in the last few – will likely need to be retired prior to fully recovering their capital investment or before the end of their operational lifetime.”

These changes are even more stark for the electricity sector, which is “virtually full[y] decarbonised…around mid-century”. This means that by 2050, coal use in the power sector falls to “close to 0%” and renewables supply 70-85% of the electricity mix.

Not including bioenergy, renewable deployment in 1.5C pathways increases between six and 14-fold by 2050, compared to 2010. Nuclear energy use increases in “most” 1.5C pathways, the report says – but not in all of them.

In addition, 1.5C pathways all include deep cuts in other greenhouse gases, such as a 35% reduction in methane emissions below 2010 levels by 2050.

“The energy transition is accelerated by several decades in 1.5C pathways compared to 2C pathways,” chapter two explains.

In addition to shifting to zero-carbon electricity, extra reductions in 1.5C versus 2C pathways come mainly from transport and industry, it says, with emissions from industry falling 75-90% below 2010 levels by 2050.

Furthermore, energy demand is tempered to a greater degree by efforts to improve end-use efficiency.

It is worth noting that IAMs have a well-known bias towards technological solutions, such as switching the source of energy supply or adding carbon capture and storage(CCS). Scientists have started to explore other ways to limit warming to 1.5C, for example by radically changing the way energy is used.

Finally, it is worth adding that IAM pathways are only really able to explore what is technically feasible. As explained in a lengthy section of chapter one of the report, this is distinct from what is socially, environmentally, politically or institutionally feasible.

Though some aspects of these broader questions are explored in chapter four (pdf), the report does not – and cannot – say whether it will, ultimately, be possible to avoid 1.5C of warming.

What does the report say about the remaining carbon budget for 1.5C?

One of the key tools that scientists have used in recent years to communicate the urgency of cutting emissions to meet the 1.5C limit is the idea of a “carbon budget”. This is essentially the amount of CO2 the human activity can emit into the atmosphere and still hold warming to the 1.5C limit.

Based on estimates made in the IPCC’s most recent assessment report (“AR5”), published in 2013-14, there were around 120 gigatonnes of CO2 (GtCO2) remaining in the budget from the beginning of 2018 for a 66% chance of avoiding 1.5C warming. That is equivalent to just three years of current global emissions.

However, since AR5 was published, a number of new research papers using different methods have suggested that the 1.5C is actually substantially larger. And as the remaining budget for 1.5C is – by any measure – relatively small, the choice of approach can make quite a difference.

The IPCC’s report takes these new approaches on board and expands the 1.5C budget, pushing it out to 420GtCO2 – equivalent to around 10 years of current emissions.

In a separate analysis piece published today, Carbon Brief has delved into the detail of this new, larger carbon budget and expanded on the reasons behind the shift.

Despite the change, it is worth noting that the key message remains the same: global CO2 emissions need to fall to net-zero by mid-century to avoid 1.5C of warming.

And even with the revised 1.5C carbon budget, it is unlikely to be the end of the debate. There are still a number of large uncertainties remaining, such as how to account for non-CO2 factors, what observational temperature datasets should be used, and whether Earth-system feedbacks, such as melting permafrost, are taken into account.

What role will ‘negative emissions’ play in limiting warming to 1.5C?

The report acknowledges that limiting warming to 1.5C will require the use of “negative emissions technologies” (NETs) – methods that remove CO2 from the atmosphere. In the report, these techniques are referred to as “carbon dioxide removal” (CDR).

To limit global temperature rise to 1.5C without overshoot, some use of NETs will be needed, the SPM notes:

“All pathways that limit global warming to 1.5C with limited or no overshoot project the use of CDR on the order of 100-1,000GtCO2 [billion tonnes] over the 21st century.”

And, if global temperatures do overshoot 1.5C, large-scale use of NETs will be required in order to bring warming back down, Prof Piers Forster told a press briefing:

“I think one of the most of the important things in the terms of this 1.5C report are these high overshooting scenarios where temperatures go above 1.7C and then return to below 1.5C by the end of the century. These scenarios will only be possible if we hugely invest in, scale up and build the technology for CO2 removal.”

It is worth noting that the SPM appears to underestimate the degree to which NETs could be needed in order to limit warming to 1.5C in comparison to the full report, says Dr Oliver Geden, head of the research at the German Institute for International and Security Affairs, who was not a report author. He tells Carbon Brief:

“The SPM states that conventional mitigation is not enough and that there’s an additional need for CDR. Compared to the full report, the SPM paints too rosy a picture on this. The SPM talks about 100-1,000GtCO2 removal by 2100. But the report itself shows a mean CDR value much closer to the upper end of the 100-1,000GtCO2 range.”

The amount of CO2 that will need to be removed using NETs depends on how quickly and effectively cuts are made to global greenhouse gas emissions, the report says.

Even with rapid mitigation efforts, it is likely that NETs will be required to offset emissions from sectors that cannot easily reduce their emissions to zero, researchshows. These sectors include rice and meat production, which produce methane, and air travel.

The degree to which NETs will be needed matters because each of them come with “economic and institutional barriers” – as well as possible impacts on people and wildlife, Prof Heleen de Coninck, a researcher in climate change mitigation and policy from Radboud University in the Netherlands and coordinating lead author of chapter four of the report, told a press briefing.

For instance, several of the NETs would require the world to drastically change the way it uses the land. This includes bioenergy with carbon capture and storage (BECCS) and afforestation.

BECCS involves growing crops, burning them to produce energy, capturing the CO2 that is released during the process and storing it in an underground site. Afforestation, meanwhile, involves turning barren land into forest. Because plants absorb CO2 as they grow, both techniques would effectively remove CO2 from the atmosphere.

However, if these techniques were deployed at scale, they could compete for land with food production and natural habitats, the SPM says:

“Afforestation and bioenergy may compete with other land uses and may have significant impacts on agricultural and food systems, biodiversity and other ecosystem functions and services.”

The charts below show four possible pathways for reaching 1.5C. On the charts, grey shows fossil fuel emissions, while yellow and brown show the emissions reductions achieved by BECCS, and agriculture, forestry and other land use (AFOLU), respectively.

(Note that AFOLU also includes emissions reductions from other land-based NETS, such as natural forest regeneration and soil carbon sequestration.)

Four illustrative scenarios for limiting temperature rise to 1.5C above pre-industrial levels. Grey shows fossil fuel emissions, while yellow and brown show the emissions reductions achieved by BECCS, and agriculture, forestry and other land use (AFOLU), respectively. Source: Summary for Policymakers, IPCC

Four illustrative scenarios for limiting temperature rise to 1.5C above pre-industrial levels. Grey shows fossil fuel emissions, while yellow and brown show the emissions reductions achieved by BECCS, and agriculture, forestry and other land use (AFOLU), respectively. Source: Summary for Policymakers, IPCC

The P1 pathway assumes that the world rapidly reduces its fossil fuel emissions after 2020. This is largely achieved by reducing the global demand for energy, chiefly by switching to more energy-efficient technologies and behaviours. This pathway requires a relatively small amount of negative emissions, which is expected to be achieved via afforestation.

The P2 pathway also sees the world switch towards sustainable and healthy consumption patterns, low-carbon technology innovation, and well-managed land systems – this time with a limited amount of BECCS.

The P3 pathway is a “middle-of-the-road scenario” in which historical social and economic trends continue. Emissions reductions are mainly achieved by changing the way in which energy is produced and to a lesser degree by reductions in demand. This scenario requires a relatively large amount of BECCS.

The P4 pathway is a “resource and energy-intensive scenario”, which sees a growth in demand for high-energy products, such as air travel and meat. Emissions reductions are mainly achieved through BECCS.

(Pathways 1-3 see little-to-no overshoot of the 1.5C target, whereas P4 expects a high chance of overshoot.)

The chart below – which is taken from page 46 of chapter two (pdf) of the main report – shows the expected land-use change in 2050 and 2100 under each scenario. It is important to note that, on this chart, P1, P2, P3 and P4, correspond with “LED”, “S1”, “S2” and “S5”, respectively.

On the chart, expected land-use change for food crops (pink), energy crops (orange), forest (turquoise), “natural” land (blue) and pasture (green) are shown. Any number below zero indicates an overall decrease, while any number above shows expected increase.
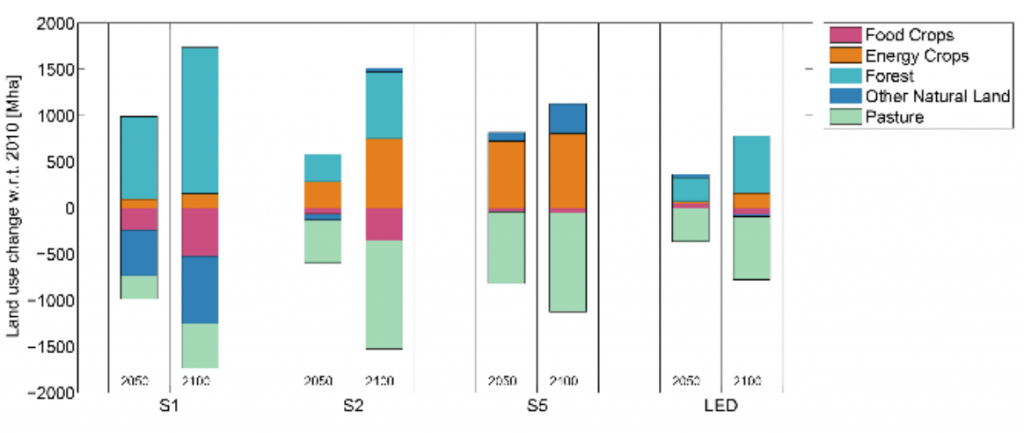
 

Expected land-use change (million hectares) under four illustrative scenarios for limiting global warming to 1.5C above pre-industrial levels. Land-use change for food crops (pink), energy crops (orange), forest (turquoise), “natural” land (blue) and pasture (green) are shown. Source: IPCC

Expected land-use change (million hectares) under four illustrative scenarios for limiting global warming to 1.5C above pre-industrial levels. Land-use change for food crops (pink), energy crops (orange), forest (turquoise), “natural” land (blue) and pasture (green) are shown. Source: IPCC

The chart indicates how that, even in the scenario assuming the lowest possible reliance on negative emissions (P1/LED), land-use change is still expected to be substantial. Under P1/LED, it is assumed that 500m hectares of land – an area that is roughly twice the size of Argentina – is converted to forest by 2100. The pathway expects a similar-sized reduction in pastureland.

The P2/S1 pathway, which sees only limited use of BECCS, also expects large areas of land to be converted to forests, the report authors note on page 45:

“In pathways that allow for large-scale afforestation in addition to BECCS, land demand for afforestation can be larger than for BECCS. This follows from the assumption in the modelled pathways that, unlike bioenergy crops, forests are not harvested to allow unabated carbon storage on the same patch of land.”

However, in addition to the possible impacts of each of the NETs, the researchers also had to consider their overall level of “maturity” – or feasibility, Prof Jim Skea, co-chair of working group III (WG3) and chair of sustainable energy at Imperial College London, told a press briefing:

“Some of the nature-based techniques are definitely mature in the sense that we are doing them now and they are ready – it’s a question of the scale and the incentives that are needed for seeing them through.”

These “nature-based techniques”, which are also known as “natural climate solutions”, include afforestation, natural habitat regeneration and enhancing soil carbon stocks.

In comparison, BECCS should be considered less mature than nature-based methods, Skea says. This is because, although carbon capture and storage (CCS) has been demonstrated on a small scale at several sites across the world, it has not been shown to work alongside bioenergy at scale. “We’ve never really combined them together,” he says:

“Some of the other methods are lot more conceptual – for example, the enhanced weatheringof rock. Scientists believe it could be done. That’s what’s meant by the different levels of maturity. Some are ready to go now – they just need more incentives, others need a bit more development work.”

Could ‘solar geoengineering’ play a role in meeting 1.5C?

Solar geoengineering is only mentioned once in the SPM and 11 times in chapter four(pdf) of the report, where it is referred to as “solar radiation modification” (SRM).

SRM refers to a group of untested technologies that could, theoretically, reduce global warming by increasing the amount of sunlight that is reflected away from the Earth.

The report lists four of what it calls the “most-studied” options for SRM: stratospheric aerosol injection, marine cloud brightening, cirrus-cloud thinning and high-albedo crops and buildings. (More information on how these methods would work is detailed in Carbon Brief’s explainer on SRM.)

A lack of available scientific research led the authors to focus on just one of the proposed options, Prof Heleen de Coninck told the press briefing:

“The type of SRM we looked at was mainly stratospheric aerosol injection because that is what most of the literature is about. There’s been no experiments done so there’s no experimental evidence to assess – that’s why we’re saying it can only theoretically be effective in reducing the temperature.”

In accordance with the available scientific research, the report only considers “SRM as a supplement to deep mitigation, for example, in overshoot scenarios,” the authors say. The SPM reads:

“Although some SRM measures may be theoretically effective in reducing an overshoot, they face large uncertainties and knowledge gaps as well as substantial risks, institutional and social constraints to deployment related to governance, ethics, and impacts on sustainable development. They also do not mitigate ocean acidification.”

One ethical concern is a possible “moral hazard effect”, de Coninck says, which is the idea that research and development into solar geoengineering could deter policymakers from pursuing stringent mitigation.

Another risk mentioned in the report is “termination shock”. This is the fear that, if solar geoengineering was deployed and then suddenly stopped – as a result of political disagreement or a terrorist attack, for example – global temperatures could rapidly rebound.

This sharp temperature change could be “catastrophic” for wildlife, studies have suggested. However, other research argues that the likelihood of a termination shock has been “overplayed” and that measures could be put in place to ensure that the risk is minimised.

Many of the risks posed by SRM have not yet been adequately assessed by scientific research, de Coninck says:

“We’re not saying it’s not viable – that would be going beyond the IPCC’s mandate – but we’re noting that…it’s still a very developing field.”

What are the costs and benefits of meeting the 1.5C limit?

One obvious question about the 1.5C limit is whether it is worth meeting. In other words, do the benefits of avoided climate damages due to flooding, for example, outweigh the cumulative costs of cutting emissions?

Unfortunately, SR15 explicitly does not look at the total cost of 1.5C pathways. This is because the scientific literature on the subject is “limited”. Instead, the report looks at the global average “marginal abatement costs” this century. In other words, the costs per tonne of avoided emissions.

These marginal abatement costs are sometimes ambiguously referred to as the price of carbon used in IAM model pathways. This is not the same as a target or “required” carbon price in the real world, not least because IAMs often use a carbon price as a proxy for all other climate policy. Chapter two explains:

“A price on carbon can be imposed directly by carbon pricing or implicitly by regulatory policies. Other policy instruments, like technology policies or performance standards, can complement carbon pricing in specific areas.”

Nevertheless, the evidence suggests that carbon pricing should increase in order to meet more stringent climate goals, says chapter two.

In general, the SPM says that marginal abatement costs are roughly three to four times higher in 1.5C pathways, compared to 2C. It also sets out estimated investment needs for 1.5C pathways:

“Total annual average energy-related mitigation investment for the period 2015 to 2050 in pathways limiting warming to 1.5C is estimated to be around $900bn…Annual investment in low-carbon energy technologies and energy efficiency are upscaled by roughly a factor of five by 2050 compared to 2015.”

The SPM adds that “knowledge gaps” make it difficult to compare these mitigation costs against the benefits of avoided warming. For example, adaptation costs at 1.5C “might” be lower than for 2C, the SPM says, though it adds that costs are “difficult to quantify and compare”. Chapter two says:

“Pathways that are consistent with sustainable development show fewer mitigation and adaptation challenges and are associated with lower mitigation costs.”

Notably, however, while IAM pathways set out the costs of limiting warming to 1.5C, they do not generally consider the benefits of doing so, says the technical annex (pdf) to chapter two.

Meanwhile, these potential avoided climate damages from limiting warming to 1.5C are highly uncertain, as chapter three (pdf) of the report explains:

“Balancing of the costs and benefits of mitigation is challenging because estimating the value of climate change damages depends on multiple parameters whose appropriate values have been debated for decades (for example, the appropriate value of the discount rate) or that are very difficult to quantify (for example,the value of non-market impacts; the economic effects of losses in ecosystem services; and the potential for adaptation, which is dependent on the rate and timing of climate change and on the socioeconomic content).”

The best estimate of cumulative discounted damages due to 1.5C of warming by 2100 amounts to $54tn, the report says, rising to $69tn for 2C.

Will the world be able to adapt to 1.5C and beyond?

The report finds that, in general, the need for adaptation to climate change will be lower at 1.5C than 2C. However, it warns that, even if global warming is limited to 1.5C, it will not be possible to prepare for all of the impacts of climate change.

The report describes human adaptation to climate change as “the process of adjustment to actual or expected climate and its effects, in order to moderate harm or exploit beneficial opportunities”.

There are a number measures that could be taken to limit the impact of climate change on humans, the report says.

The table below – taken from pages 38-9 of chapter four (pdf) of the report – details eight “overarching” options for adaptation. The first column lists the conditions needed for the options to work and the second offers examples of where the options have already been implemented.
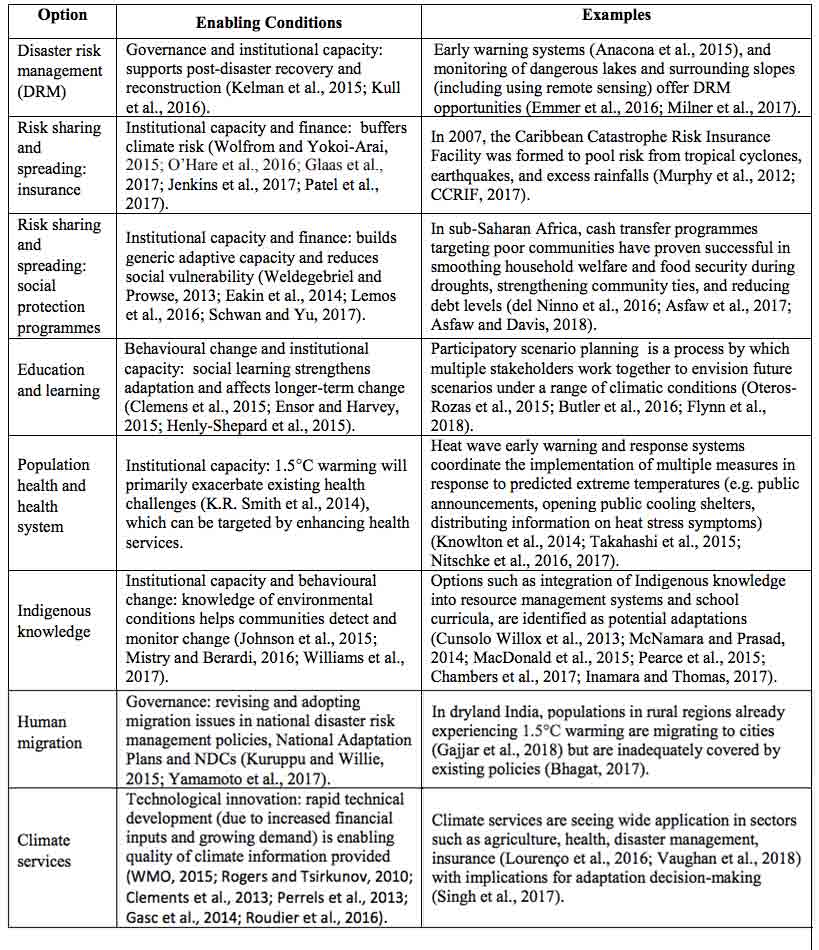
Eight “overarching” options for adapting for climate change. The first column lists the conditions needed for the options to work and second offers examples of where the options have already been implemented. Source: IPCC

Eight “overarching” options for adapting for climate change. The first column lists the conditions needed for the options to work and second offers examples of where the options have already been implemented. Source: IPCC


The first option, disaster risk management, is defined by the authors as “a process for designing, implementing and evaluating strategies, policies and measures to improve the understanding of disaster risk, and promoting improvement in disaster preparedness, response and recovery”.

As temperatures continue to rise, there is likely to be an “increased demand to integrate DRM and adaptation”, the authors write, “to reduce vulnerability, but institutional, technical and financial capacity challenges in frontline agencies constitute constraints”.

Another adaptation option discussed in the table is migration. The report notes that, at present, there is “low agreement as to whether migration is adaptive, in relation to cost effectiveness”. It says:

“Migrating can have mixed outcomes on reducing socio-economic vulnerability and its feasibility is constrained by low political and legal acceptability, and inadequate institutional capacity.”

In contrast to the report, migration is not listed as an adaptation option in the SPM.

The last adaptation option, “climate services”, refers to the possible dissemination of relevant climate information via daily forecasts and weather advisories, as well as seasonal forecasts and even multi-decadal projections. These kinds of services are already being used in sectors such as agriculture, health, disaster management, the report notes.

A number of steps could also be taken to reduce the risks facing natural ecosystems, the report says. These include restoring degraded natural spaces, strengthening actions to halt deforestation and pursuing sustainable agriculture and aquaculture.

The total costs associated with adapting to global warming of 1.5C are “difficult to quantify and compare with 2C,” says the SPM. This is largely to gaps in the scientific literature, the report authors say.

The SPM notes that adaptation has, typically, been funded by public sector sources, such as national governments, channels associated with the UN and through multilateral climate funds.

What are the links between 1.5C and poverty?

The final chapter of the report (chapter five, pdf) is dedicated to examining how climate change could impact sustainable development, poverty and inequality.

The SPM notes that, across the world, poorer communities are likely to be impacted disproportionately by global warming of 1.5C or higher.

“Populations at disproportionately higher risk of adverse consequences of global warming of 1.5C and beyond include disadvantaged and vulnerable populations, some indigenous peoples, and local communities dependent on agricultural or coastal livelihoods.”

A large proportion of the world’s poor rely on subsistence farming and so will be directly affected by the impact of climate change on temperature, rainfall and drought, says Prof Chuks Okereke, lead author of chapter five from the department of geography and environmental science at the University of Reading. He told a press briefing:

“A key finding of the report is these efforts to limit global warming to 1.5C can actually go hand in hand with many other intended to address issues of inequality and poverty eradication.”

In fact, limiting temperature rise to 1.5C rather than 2C could save “several hundred million” people from facing poverty by 2050, according to the report.

In addition, limiting global warming could also help the world to achieve many of the UN sustainable development goals (SDGs), the report says. The 17 SDGs are a set of targets, agreed in 2015, that aim to “end poverty, protect the planet and ensure that all people enjoy peace and prosperity” by 2030, according to the UN Development Programme.

It is worth noting, however, that, in some cases, actions to limit warming to 1.5C could come with trade-offs with the SDGs, the SPM notes:

“Mitigation options consistent with 1.5C pathways are associated with multiple synergies and trade-offs across the SDGs. While the total number of possible synergies exceeds the number of trade-offs, their net effect will depend on the pace and magnitude of changes, the composition of the mitigation portfolio and the management of the transition.”

The chart below summarises the potential positive (synergies) and negative (trade-offs) effects of mitigation options for reaching 1.5C on each of the SDGs. On the chart, the total length of the bars represent the size of the positive or negative effect, while shading shows the level of confidence (light to dark: low to very high).

The mitigation techniques are split into three sectors: energy supply, energy demand and land. Options assessed in the energy supply sector include biomass and renewables, nuclear, BECCS, and CCS with fossil fuels. The energy demand sector comprises options for improving energy efficiency in the transport and building sectors. The land sector comprises afforestation and reduced deforestation, sustainable agriculture, low-meat diets and a reduction in food waste, and soil carbon management.

You can read the Q&A in its entirety here.

What’s next?

In the short term, the report will be used immediately by the people who first requested it nearly three years ago in Paris – the world’s governments.

Climate negotiators from almost 200 countries are due to meet in Poland in December at the next annual round of talks. The IPCC report is certain to be cited and quoted by negotiators from a variety of countries as they, among other things, try to agree on the “rulebook” for the Paris Agreement.

The IPCC itself will now turn its attention to two more special reports before it publishes its sixth assessment report (pdf) in 2021. In September 2019, at a meeting in Kenya, it is due to finalise a special report on the “ocean and cryosphere in a changing climate”. At the same time, it will also finalise a special report on “climate change and land”.

In the UK, the government said earlier this year that, once the IPCC report is out, it will ask its official advisory body, the Committee on Climate Change, to assess the “implications” of revising the Climate Change Act 2008 to better reflect the Paris Agreement’s goals.

The Climate Change Act legally commits the UK to reduce its greenhouse gas emissions by “at least” 80% by 2050 against 1990 levels. Claire Perry, the minister for energy and clean growth, has said on a number of occasions since that announcement in April that governments need to “raise ambition to avert catastrophic climate change”.

As Carbon Brief explained at the time, the CCC has already said that a global 1.5C limit would mean a more ambitious 2050 goal for the UK, in the range of 86-96% below 1990 levels, as well as setting a net-zero target at some point.

U.S. utility solar contracts ‘exploded’ in 2018 despite tariffs: report

By Nichola Groom
View the original article here.

(Reuters) – Procurement of solar energy by U.S. utilities “exploded” in the first half of 2018, prompting a prominent research group to boost its five-year installation forecast on Thursday despite the Trump administration’s steep tariffs on imported panels.

An array of solar panels is seen in the desert near Victorville, California, U.S. March 28, 2018. REUTERS/Lucy Nicholson/File Photo

An array of solar panels is seen in the desert near Victorville, California, U.S. March 28, 2018. REUTERS/Lucy Nicholson/File Photo

A record 8.5 gigawatts (GW) of utility solar projects were procured in the first six months of this year after President Donald Trump in January announced a 30 percent tariff on panels produced overseas, according to the report by Wood Mackenzie Power & Renewables and industry trade group the Solar Energy Industries Association.

As a result, the research firm raised its utility-scale solar forecast for 2018 through 2023 by 1.9 GW. The forecast is still 8 percent lower than before the tariffs were announced. A gigawatt of solar energy can power about 164,000 homes.

FILE PHOTO: An array of solar panels is seen in the desert in Victorville, California March 13, 2015. REUTERS/Lucy Nicholson/File Photo

FILE PHOTO: An array of solar panels is seen in the desert in Victorville, California March 13, 2015. REUTERS/Lucy Nicholson/File Photo

Procurement soared in part because the 30 percent tariff was lower than many in the industry had feared, the report said. SEIA strongly lobbied against a tariff, saying it would drive up the cost of solar and hurt the industry’s robust job growth.

In addition, panel prices have fallen faster than expected because China pulled back its subsidies for the renewable power source in June, creating an oversupply of modules in the global market that has eroded the impact of the tariff.

Module prices averaged 42 cents a watt in the second quarter, the report said, 2 cents higher than the same period in 2017 but far below the 48 cents a watt they hit late last year as the industry fretted about a looming duty on imports.

In every segment of the market except residential, system pricing is at its lowest level ever, the report said. Utility projects make up more than half the solar market.

Utilities are eager to get projects going because of a federal solar tax credit that will begin phasing out in 2020. Next year will be the most impacted by the tariffs, Wood Mackenzie said. Developers will begin projects next year to claim the highest level of tax credit but delay buying modules until 2020 because the tariff drops by 5 percent each year.

In the first half of the year, the U.S. installed 4.7 GW of solar, accounting for nearly a third of new electricity generating capacity additions. In the second quarter, residential installations were roughly flat with last year at 577 MW, while commercial and industrial installations slid 8 percent to 453 MW.

We don’t need more doomsday climate predictions. We need solutions — like this one.

By David Von Drehle
View the original article here.

High waters flood Market and Water Streets as Hurricane Florence comes ashore in Wilmington, N.C., on Friday.

High waters flood Market and Water Streets as Hurricane Florence comes ashore in Wilmington, N.C., on Friday.

Like most people (according to polls), I believe greenhouse gases trap heat — a fact easily proved by experiments simple enough to perform at home. More greenhouse gases will trap more heat. And when temperatures rise on Earth, they impact the entire ecosystem.

The case for limiting emissions of carbon dioxide and other greenhouse gases is all right there. Most people get it. Yet many of our most passionate citizens on this topic seem to believe that only panic will produce results. In trying to stimulate alarm, however, they often wind up fortifying the dwindling but stubborn cadre of skeptics.

Case in point: Hurricane Florence. As the cyclone worked its way up the Saffir-Simpson scale of storm strength, I braced for the inevitable pronouncements that climate change is making our storms worse, with Florence as Exhibit A. Then the incredible complexity of climate kicked in. The cyclone went to pieces (as most of them, thankfully, do) and staggered ashore as a very wet and dangerous Category 1 storm. Power was knocked out, homes were flooded, trees were snapped or torn up by the roots. An unpleasant, unwelcome visitor, but hardly unprecedented.

Climate activists should get out of the prediction business, because climate is too complex to be reduced to a single factor. The strongest storm to hit the United States continues to be the Labor Day hurricane of — wait for it — 1935, which wiped out entire towns in the Florida Keys. Runner-up: Camille in 1969. Billions and billions and billions of tons of carbon dioxide have been pumped into the atmosphere since those storms raged.

Looking backward rather than ahead, however, a tentative case, a hypothesis, could be ventured that we are in fact seeing greater frequency of strong storms. Since the introduction of weather satellites in the 1960s made comprehensive tracking possible, meteorologists have calculated the total energy of Atlantic cyclones each year. All seven seasons of greatest hurricane energy have come since 1995. Even so, the years from 2013 through 2015 were unusually calm.

But debating over doomsdays only empowers the climate skeptics, because it takes a topic of consensus and puts it in the realm of dispute. People don’t need more fear of climate change. They need more hope for solutions. And one single step could galvanize the awesome power of America’s economy toward answers: cap and trade.

Capping total carbon dioxide emissions nationwide and allowing producers to trade emission permits are not an intrusion on the free market, as some conservatives have complained of the trailblazing program underway in California. Instead, cap and trade empowers the market. As Adam Smith explained, the wealth-creating genius of a free market stems from its ability to efficiently gather vast stores of data about people’s needs and wants and convey that information to producers through the simple signal of what people are willing to pay. Good old supply and demand.

Carbon emissions impose social costs. But most of the U.S. economy is blind to that information. Without an overall cap on emissions, the market thinks that supply — in this case, the ability to emit carbon dioxide into the atmosphere — is infinite and thus the cost of emitting is zero. Cap and trade switches on a price signal, which in turn focuses the creativity, innovation and efficiency of the entire economy on cutting emissions without sacrificing quality of life. The free market does what it does best (more Adam Smith): lowers production costs while maintaining and enhancing the appeal of its products.

Opponents of cap and trade say the idea has failed in Europe, but the hiccups in that market are attributable to weakness of the European Union — Brussels set its cap too high — and the slow European economy. A more revealing case comes from here at home. In 1995, the United States capped sulfur dioxide emissions (the primary cause of acid rain) and issued tradable permits. By 2010, according to one gimlet-eyed assessment, emissions were down nearly 70 percent and health-care costs were reduced by as much as $100 billion.

Admittedly, carbon emissions are a more complex market than sulfur emissions. Everyone has a carbon footprint, while sulfur dioxide is mainly a byproduct of coal-burning power plants. But there are many ubiquitous commodities in our lives: virtually everyone uses steel, paper, electricity, water, wheat and so on. Somehow, the market manages to put a price on all of them and efficiently collect those costs from willing consumers.

When carbon-dioxide emissions reflect what most of us agree to be their true costs, capitalists throughout the economy will turn their resources to cutting those costs. They will discover greater efficiencies. They will invest in alternative energy. They will sink money into inventions and technologies undreamed of today. They will move with speed and agility no government bureaucracy can match.

You might say I’m predicting a Category 5 storm of hope. But this is the U.S. economy I’m talking about; its potential power is never in doubt.