Growing a circular economy: Ending the Throwaway Society

PJ Pictureby Paul L. Jones, CPA & LEED Green Associate

recycleIn our February issue of Sustainable Benefits, Kendall Gillen introduced the concept of a Circular Economy (see “The Changing Face of Waste Management and the Shift Toward a Circular Economy“) by contrasting it with “today’s linear consumerist society. Once a material of substance is no longer considered useful, it is discarded and left in the hands of waste management….”

“Circular Economy” is defined as “a generic term for an industrial economy that is producing no waste or pollution, by design or intention, and in which material flows are of two types: biological nutrients, designed to reenter the biosphere safely and technical nutrients, which are designed to circulate at high quality in the production system without entering the biosphere as well as being restorative and regenerative by design.” (Wikipedia)

In its report published in July 2014, “Growing a circular economy: Ending the throwaway society,” Great Britain’s House of Commons Environmental Audit Committee says, “The current way our economy consumes resources is not sustainable. A ‘linear approach – where materials are extracted, made into a product, used and discarded – wastes valuable resources and damages the environment. In addition, increasing levels of consumption in developing countries will put ever more pressure on the prices of materials and subsequent costs for businesses and consumers. A ‘circular’ approach of re-using resources, maximizing their value over time, makes environmental and economic sense. There are potentially billions of pounds (or dollars) of benefits for businesses across the economy by becoming more resource efficient.”

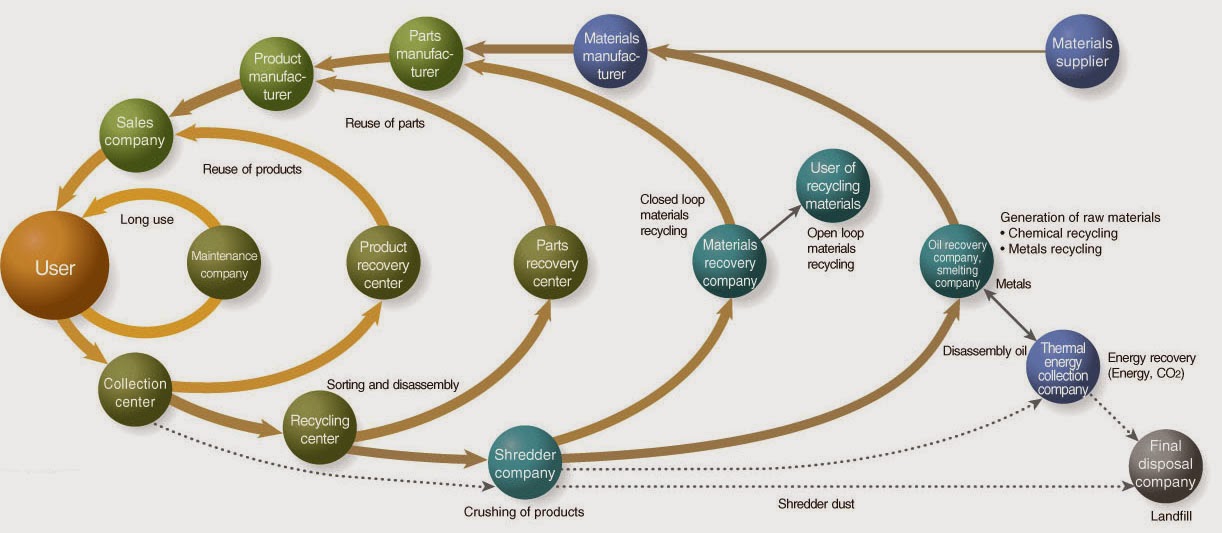
An early concept introduced way back in September 2009 was the circular nature of sustainability as practiced in society represented by the Ricoh Cornet Circle reproduced below.
Comet Circle

In a 2015 report, Jennifer Gerholdt, environmental program director of the US Chamber of Commerce Foundation, wrote: “If we continue with the business-as-usual approach, companies and society will witness a probable surge in price volatility, inflation of key commodities, and an overall decline — and in some cases, depletion — of critical material inputs.” In fact, according to the World Economic Forum, commodity prices rose more than 150 percent between 2002 and 2010.

In her June 23rd article, “The Evolving Ton and the Circular Economy, “Elizabeth Comere, Director of Environmental and Government Affairs for Tetra Pak, reports: “At the Sustainability in Packaging Conference held in Chicago this past April, a surprising number of presentations focused on packaging recycling topics. Increasing consumer access to recycling, changing recycling behavior through labeling and better linking brand owners with recyclers were among the topics covered. Five years ago, recycling took a backseat to topics such as sustainable design and life cycle analysis.   A primary reason for this shift in emphasis is the growing realization of the importance of having an effective post-consumer materials recovery and recycling system, and secondly, concern over the fact that the current system in the United States is falling short of meeting this objective.”

Many companies, including Google and Dell, are already implementing a circular economy model. They are partnering with the Ellen MacArthur Foundation on closed-loop initiatives. These firms see the circular economy not only as a way to reduce waste and improve sustainability performance, but also increase competitiveness, new product development and overall sales. Between January 2014 and August 2015, Dell used more than 4,500 metric tons of post-consumer recycled plastics in its products. Cumulatively, the company has used closed-loop recycled-content plastic across 34 products globally through its closed-loop supply chain, turning waste into a resource.

Analysts have showed that there is considerable financial opportunity, as well as environmental benefit, associated with a scaled-up circular economy. In particular, in the electronics sector, precious metals recovery represents a significant business opportunity. Trucost estimates that if recovery of gold, silver and platinum increased from current rates to 100 percent, the financial and natural capital benefits would increase by $10 billion.

“A shift from a linear to a circular economy could unlock an estimated $4.5 trillion in additional economic growth by 2030,” Gerholdt is quoted by Environmental Leader in an article by Jessica Lyons Hardcastle published 11/19/2016. “The circular economy has captured the imagination of many companies that see the economic innovation opportunities of this more restorative model to tackle sustainability challenges, drive performance, competitiveness and innovation, and stimulate economic growth and development.”

When it comes to burnishing your organization’s or your building’s brand and cleaning its footprint, the efforts center on reducing, reusing and recycling nearly every material used – regardless of whether it is in production, operations or management  According to Dan Gilbert, Head of global sustainability for international facilities management company, ISS, the ultimate aim, is to create “zero waste,” which can mean eliminating anywhere from 90% to 100% of the waste your company is putting into landfills. The last 10%, he emphasized, is where the real work is. To get there, organizations need to measure and manage their waste streams, and report their progress at least on a quarterly basis.

“What is the cost of recycling versus putting it in the trash,” Gilbert tells us; “If you save money, your corporate leadership is more likely to get behind the initiative.” For commercial real estate, your tenants will recognize it and value efforts to achieve zero waste.

While many sustainability efforts do require an upfront investment in time and resources, they build a positive community image as well as among potential tenants. Some examples include:

Computers would be the worst thing to toss in the landfill, says Gilbert. That’s because they have an “encyclopedia of metals” that can leach into the ground water system.

Other things that businesses can recycle include office supplies, office equipment, boxes, shelving and racks. Furthermore, cement, asphalt, wood, carpet, pellets and drywall can be recycled or reused.

The companies that accept those items might pay the corporate donor for the materials that will ultimately go into new products. If a mobile phone is built from recycled parts, it prevented waste from going into the landfill and it has created a perfectly good use of still viable parts. Similarly, recycling LCD screens, computer and medical equipment would have the additional benefit of preserving significant amounts of raw materials, such as Gallium in LCS screens and integrated circuits, Beryllium, Niobium and Helium in medical equipment and increasing the affordability of new medical equipment.

Buildings with in-house cafeterias can compost their food waste rather than ditch it in the trash. “Food waste is heavy and it breaks down and creates methane,” says Gilbert. Instead, it can be composted and that enriches the soil.  Things like plastic scraps, tableware and coffee cups can also be eco-friendly — meaning they are biodegradable and can be turned into compost.

  • Reported today by Environmental Leader. “Dozens of major companies including ABC Disney, Whole Foods and Anheuser-Busch with offices in New York City have diverted at least half of their waste from landfills and incineration, responding to Mary Bill de Blasio’s Zero Waste by 2030 challenge. The 31 business participants collectively diverted 36,910 tons of waste by increasing recycling, composting more than 24,500 tons of organic material and donating 322 tons of food, according to the mayor’s officer”

Every building owner and every business can take steps to be more environmentally friendly. One of the quickest ways to do so is to create separate bins for the recyclables and the real trash — but not to mix the two. Doing so, says Gilbert, could taint the bottles, plastics and papers. And a “single-stream” deposit in which everything goes into one bin is better than having different ones for different items.

As for the businesses that have to invest in the bins: “It’s hard enough to get them to buy one, much less four or five of them,” says Gilbert. A central place to put all recyclables is therefore the best solution. Having trouble finding a vendor to pick up such items? Start with the company that picks your trash, Gilbert said. And if that doesn’t work, get on line and look for one.

He points to a Utah State University audit that found 20-40 percent of the stuff that goes into the trash could be recycled.

The Ellen MacArthur Foundation says the circular economy concept is gaining traction in the US because of the opportunities it offers businesses willing to capture new value from existing operations and resources, for example by redesigning products and business models, building new relationships with customers, harnessing technology to increase the utilization of assets, and switching to renewable energy.

Given the 7.4 Billion people who now roam this earth and the fact that our natural resources are not unlimited, The linear “take, make, dispose” model is not sustainable. We can no longer afford to throw away materials that can be re-used or recycled.

According to Nichola Mundy, senior consultant at Axion Consulting, “The circular economy aims to develop closed-loop business systems that enables economic growth whilst decoupling it from resource consumption. Circular economy business models, such as leasing, allow full traceability of materials and enables the business to keep hold of its resources.”

As Ms. Gillen, LEED Process Manager at Emerald Skyline, noted in her February article, “Since construction and demolition waste constitutes one-third of all waste, it is necessary that the (commercial real estate) industry be methodically directed toward a circular economy, minimizing waste and maximizing value.

Emerald Skyline Corporation, whose principals include real estate, sustainability, resiliency, architecture and biological science professionals is uniquely qualified to advise you on how your organization can be a good corporate citizen and begin reaping the sustainable benefits of a circular economy. We can provide you with the tools and guidance you need to save money by being resourceful.

Remember the old adage “One person’s trash is another person’s treasure.” It’s time for us to realize, it is a treasure for all of us.

This 21-Year-Old May Have Found The Way To Clean Up The Plastic In Our Oceans

by Alejandro Davila Fragoso Jun 28, 2016 8:00 am ThinkProgress.org
View the original article here.

plastic ocean cleanup
CREDIT: The Ocean Cleanup

Boyan Slat wants to start the largest ocean clean up ever with the help of nets and ocean currents. He began testing his prototype this month.

Boyan Slat was just 16 when he realized he wanted to rid the oceans of plastic. It all happened after he dove into the problem in the most literal way while snorkeling in Greece and finding more drifting plastic than fish swimming.

“I thought, that’s a real problem. How can we come up with a solution for that?” Slat recalled during an interview with ThinkProgress.

Indeed, the problem is real and large. Around eight million metric tons of plastic waste enter the oceans every year, according to a 2015 study. In addition, recent research found so-called garbage patches in every major ocean. Plastic is so pervasive that it’s been found in sea ice, and also inside 50 percent of all species of seabirds, 66 percent of all species of marine mammals, and all species of sea turtles.

Once back in his native Netherlands, Slat delved into the topic as people told him that cleaning up the ocean was impossible. Still, Slat, a young inventor who by then already held the world record for most high-pressure rockets simultaneously launched, persisted until he found what he was looking for.

“I saw this animation where they used computer models to show that plastic actually moves” through ocean currents, Slat, now 21, said. “And then I thought, why should you move through the ocean if the ocean can move through you.”

Slat, chief executive officer of The Ocean Clean Up, has taken his eureka moment and turned it into a collection system based on floating barriers attached to the sea bed that use the ocean’s energy to gather plastic waste. After obtaining over $2 million through crowdfunding and more from Dutch government financing, Slat unveiled the first prototype last week in the North Sea, just off the coast of Netherlands.

ocean plastic cleanup 2
Less than a mile in length, this prototype is but 10 percent the size of the actual Slat wants to build to conduct what he describes as “the largest clean-up in history” on a large mass of marine debris floating in the Pacific Ocean called the Great Pacific Garbage Patch. The prototype will be in the North Sea for a year as the foundation tests if the system can withstand corrosion, storms, and more in the open sea.

“The question that we are trying to answer with this prototype is: can we build a floating barrier which is able to survive at sea for years,” said Slat. In the next twelve months, sensors will track the prototype’s every move and gather data to inform the development of the larger system. The North Sea’s minor storms are actually worse than the most powerful storms in the Pacific Ocean, Slat said. “It’s pretty safe to say that if it survives here it will survive anywhere, and certainly in the [area] of the Great Pacific Garbage Patch where we intend to deploy it.”

The Ocean Cleanup’s cleaning technology uses long floating barriers creating a v-shaped artificial coastline that catches ocean debris in its center. There, a solar-powered hydraulic pump and conveyor system scoop up waste that boats then collect and take to landfills or recycling centers. This suggests a massive logistical effort depending on how far from shore the system is placed, and the sorting of trash or other bycatch that would follow. Right now however, testing the floating barriers is crucial, so for the next year, they are focusing solely on the barrier. Therefore, plastic collection is unlikely. But “if that goes well we should be ready to deploy the first operational pilot system late next year, and that should put us on track to start the largest clean up in history by 2020,” Slat said.

Slat’s plan has received some criticism, however. One worry is that the barriers will cause too much by catch — where marine life gets accidentally caught and dies, normally in fishing nets — though the foundation’s preliminary impact statement study found a low risk of that happening. “There shouldn’t be any impact because the barrier is 1.5 meters deep (roughly 4 feet),” Slat said. “It’s really small when compared to the Pacific Ocean, and the current flows underneath it.” Still, he said this test is part of making sure the system is safe. “We are not only testing the technology,” Slat said.

Chelsea M. Rochman, a marine ecologist at the University of Toronto who’s studied the Great Pacific Garbage Patch, welcomed the clean up plan, though she favors preventing plastic from reaching the sea in the first place. “I personally think that preventing it before it goes into the ocean … is better than placing something that large in the middle of the ocean where it’s very hard to monitor,” she said. “Putting things like what he’s doing at the mouth of a river may also be more effective.”

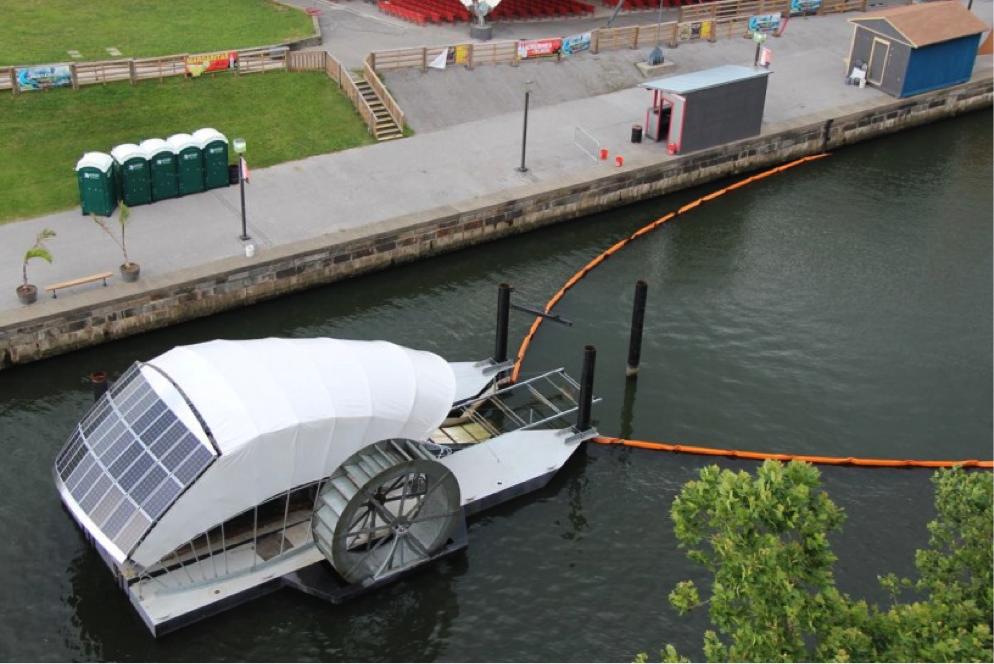
One example of a comparable system placed in a river is Baltimore’s inner harbor water wheel, also known as Mr. Trash Wheel. This device uses the Jones Falls River current to turn a water wheel which picks up debris into a dumpster barge. When the current is weak, a solar panel is in place to provide the necessary power. Since 2014, the cartoon-looking Mr. Trash Wheel has collected 420 tons of trash, including hundreds of thousands of plastic bottles, polystyrene containers, plastic bags, and millions of cigarette butts, according to the Waterfront Partnership of Baltimore.

mister trash wheel

The Inner Harbor Water Wheel, or “Mr. Trash Wheel” to locals, combines old and new technology to harness the power of water and sunlight to collect litter and debris flowing down the Jones Falls River. CREDIT: Waterfront Partnership of Baltimore

But whether the plastic collection happens in rivers or oceans, Rochman said solving ubiquitous plastic pollution requires “people like Boyan, who are doing it on their own.” At the same time, she said, more top-down solution like the federal ban on micro-beads approved in December or plastic bag bans need to happen. Furthermore, developed countries have to help emerging countries in creating better waste management, she said, since emerging nations are increasingly contributing to plastic pollution. In fact, more than half of all plastic reaching the oceans comes from China, Indonesia, the Phllipines, Thailand, and Vietnam, according to the Ocean Conservancy.

“I don’t think there is one solution to plastic debris, I really don’t,” said Rochman. “I think it’s like hundreds of little things and the more that we have that are out there and that are highlighted, I think the greater chance that we have.”

The rapid growth of electric cars worldwide, in 4 charts

The article below puts a spotlight on the swift growth of electric vehicle use worldwide. So speedy in fact, EV use has tripled since 2013. This is one of the few areas that the world’s nations are on track to keep climate change below 2 degrees celsius. Let this be a reason to keep up the good work with EV deployment, and highlight the other energy initiatives that could use improvement. With every electric vehicle that hits the road, the demand for places to charge up increases. What if I told you there was a way to not only install a charging station, but an independently owned business that can set its own pricing, access settings, and much more? Keep reading to find out…


The rapid growth of electric cars worldwide, in 4 charts

electric vehicle parking

An increasingly common sight

Written by Brad Plumer on June 6, 2016

One million down, another billion or so to go.

In a new report, the International Energy Agency estimates that 1.26 million electric cars hit the world’s roads in 2015, passing a nifty (if symbolic) milestone. Here’s a chart showing the very rapid growth of both battery electric vehicles (BEVs) and plug-in hybrids (PHEV):

evolution global electric car stock

(IEA, Global EV Outlook 2016)BEV = battery electric vehicles; PHEV = plug-in hybrid vehicles, which typically have both an electric motor and a conventional engine.

The United States now has 400,000 electric vehicles on the road — a massive increase since 2010, though well short of Obama’s goal of 1 million by 2015. Meanwhile, China has become the world’s largest market, overtaking the US in annual sales last year.

Is 1 million a lot? It depends how you look at it. It’s jaw-dropping growth given that there were only a few hundred electric vehicles on the entire planet back in 2005. And the total number of electric vehicles worldwide has tripled just since 2013.

But to put this in perspective, there are more than 1 billion gasoline- and diesel-powered cars on the world’s roads — and demand will keep soaring in the decades ahead as China and India’s middle classes expand. So we have a long, long way to go before electric cars take over the world.

In order to avoid more than 2°C of global warming, the IEA calculates, we’d likely need to see about 150 million electric cars on the road by 2030 and 1 billion by 2050 as part of a broader climate strategy. The good news, the agency says, is that this ambitious electric vehicle target seems much more feasible than it did just a few years ago.

Two big reasons for the rapid growth of EVs: public subsidies and falling battery prices

For starters, more and more countries are enacting policies to build up charging infrastructure and incentivize vehicle purchases. The table below details some of those policies, which include everything from tax breaks to tailpipe emission standards (which favor cleaner electric cars) to HOV lane access:

Electric vehicle uptake

IEA, Global EV Outlook 2016

“Ambitious targets and policy support have lowered vehicle costs, extended vehicle range and reduced consumer barriers in a number of countries,” the report says.

As a result, electric vehicles now make up more than 1 percent of sales in China, France, Denmark, and Sweden. They make up 9.7 percent of sales in the Netherlands, and 23 percent of sales in Norway, which offers some of the most generous tax incentives around, worth about $13,500 per car.

The other huge driver here is falling battery costs, which have fallen by a factor of four since 2008. Since batteries make up around one-third of the price of electric vehicles, getting this number down even further is crucial for widespread adoption.

evolution battery energy density cost

IEA, Global EV Outlook 2016

The Department of Energy estimates that battery costs need to fall to $125 per kilowatt-hour by 2022 to achieve cost-competitiveness with conventional vehicles. The IEA says this “seems realistic” given current rates of technological improvement, and points out that manufacturers like Tesla and GM have set even more ambitious cost targets.

The amount of energy that batteries can hold (known as energy density) has also improved significantly. The IEA cites various reports that electric cars will soon be able to travel more than 180 miles on a single charge — also critical for boosting consumer adoption and alleviating “range anxiety.”

Meanwhile, electric cars get all the attention, but the IEA points out that the electrification of other modes of transport, including motorcycles and buses, is just as important. Particularly in countries where these vehicles are widespread:

The electrification of road transport modes other than cars, namely 2-wheelers, buses and freight delivery vehicles, is currently ongoing in a few localised areas. With an estimated stock exceeding 200 million units, China is the global leader in the electric 2-wheelers market and almost the only relevant player globally, primarily because of the restriction on the use of conventional 2- wheelers in several cities to reduce local pollution. China is also leading the global deployment of electric bus fleets, with more than 170 000 buses already circulating today.

To help solve climate change, electric cars need to do much, much more

Here’s one last chart from the IEA, showing what electric car deployment would have to look like to help meet the emissions-reduction promises put forth at the Paris climate talks last year (around 100 million electric cars by 2030). It also shows the even faster deployment that would be needed to keep global warming below 2 degrees Celsius (about 150 million):

deployment scenarios electric cars

IEA, Global EV Outlook 2016

We’re on track now, but it’s early. In fact, as the IEA points out elsewhere, electric vehicle deployment is basically the only area where the world’s nations are on track to hit the targets needed to stay below 2 degrees Celsius.

One final caveat: As David Biello recently explained at Scientific American, electric cars aren’t inherently greener than their gasoline-powered counterparts. If you use coal-fired power plants to charge all those electric cars, the climate benefits are minimal (or, worse, negative). The IEA is well aware of this, although it also notes that electric car deployment can help support the rollout of cleaner renewable energy, too:

The climate change-related benefits of EVs can be fully harvested under the condition that their use is coupled with a decarbonised grid, an additional challenge for countries that are largely dependent on fossil fuels for power generation. Investment in EV roll-out can support this transition, e.g. increasing the opportunities available to integrate variable renewable energy.

Cleaning up the grid is a sine qua non for electric cars to help ameliorate climate change, although this hardly seems like a deal breaker for the technology. Think of it this way: If we don’t clean up the world’s electric grid, we have little chance of stopping global warming either way. The two have to go hand in hand.

End article.


Following Emerald Skyline’s recently announced partnership with ChargePoint, we have realized more and more the importance of the growth of electric vehicle use worldwide. Equally important as these EVs are the charging stations and infrastructure needed to support them. This rapid growth necessitates installation of charging stations. The industry standard for functionality and aesthetics are ChargePoint stations which are independently owned businesses that set their own pricing, access settings and much more.

To find out more information about the installation of a ChargePoint Electric Vehicle Charging Station at your home, office building, shopping center, hotel or transportation hub and join the EV revolution for a greener tomorrow, please contact us at 305.424.8704 or [email protected]

LEED Project Update

JulieBy Julie Lundin, Founder, LEED AP ID+C, NCIDQ, ASID
Director of Sustainable Interior Design for Emerald Skyline Corporation

Emerald Skyline Corporation in conjunction with Golden Spiral Design, is designing, renovating and repurposing an unoccupied industrial building located in Boca Raton, FL. This building was formerly an auto garage that stood vacant for several years and was environmentally contaminated. Our renovation includes many sustainable features with the intent to obtain LEED certification from the USGBC.

The above paragraph still holds true months later. However, we have had to re-think the project scope and move forward on a smaller scale. We spent months working on the design and drawings in preparation for submission as a development project. In our original design concept we envisioned a larger building footprint and a second floor addition. Vision often becomes qualified by reality, and our project is no exception. The property size cannot accommodate a larger building footprint and the FAR (floor area ratio) requirements limit the building size allowed. An addition of a partial second floor (FAR compliant) was our solution to the lot size and FAR restrictions. Although only a partial second floor was now being considered it would still require stairs and ideally an elevator. Also, the limited first floor square footage available to accommodate the new stairs and an elevator almost negated the second floor addition. Our conclusion was that adding the partial second floor was not adding the square footage desired, and the cost of construction and engineering did not make economic sense.

In January we made the decision to proceed with the project as a renovation of the existing building only. No additional square footage is being added. Our intent is to repair and replace what is there. The building will visually retain the auto garage industrial look but will be transformed into a sustainable, repurposed space.   As a sustainable consulting firm, it makes sense for us to not increase the size of the building. Our society often believes that bigger is better and we briefly fell into this way of thinking. Now we are committed to working within a limited space and we are re-focusing on creative design and the best use of that space.

As stated in our previous post, this project is a proposed LEED certified building. A key component of a LEED project is its reduced energy use. We have replaced the existing flat roof which was old and leaking with a new roof that has a high SRI (Solar Reflectance Index). We are also designing a high efficiency HVAC system and building envelope to optimize the energy performance of the building. All of the existing windows are being replaced with product that exceeds the Florida Code and are High Velocity, Hurricane Zone approved for Miami-Dade as our project is located in South Florida. In addition, to optimize energy performance in a hot climate our windows have a high VT (visible transmittance) and low SHGC (solar heat gain coefficient) to ensure adequate daylight is being admitted while still blocking significant quantities of solar radiant heat gain.

window radiation

LED lighting fixtures designed with specific task usage will be installed on both the interior and exterior of the building. The existing concrete floors of the auto garage are going to be polished and used as they are. The specifications of the interior finishes are just beginning and as an interior designer, this is the fun part. Low VOC products, adequate air ventilation, and controlled air temperature and humidity will be utilized to protect the buildings IAQ (Indoor Air Quality). Low flow toilets and faucets, and Energy Star appliances will all be specified to reduce the amount of water and energy that is consumed.

We hope to be in our new location by early fall. Once our building is completed we will post descriptions of the renovation details and photos. This project has been a long journey. We are proud that it is a shining example of a correct decision to repurpose a building that might have otherwise been overlooked.

The future in automotive transportation is available now: The Growing Market for Electric Vehicles and ChargePoint Charging Stations

PJ PictureBy Paul Jones, Director, Emerald Skyline Corporation

plugged in electric vehiclesFive years after the first mass-market electric car hit the market, plug-in electric vehicles (EVs) have not met with the success expected, but they are pacing the rate of hybrid cars. Numerous challenges are being overcome in the evolution of the electric vehicle – not least of which is the automakers approach to the production and marketing of the cars, the range EVs travel on one charge and the availability of charging stations.

The new generation of electric vehicles began with the introduction of the first Tesla car in 2008 and began its embryonic growth in 2010 when mainstream electric cars like the Nissan LEAF and Chevy Volt went on sale. Throughout this time, plug-in car (PEV) buyers have repeatedly complained about poor consumer experiences. Last year, Consumer Reports published the results of a secret shopper study of 85 dealerships in four states, finding that staff at 35 of those dealerships (over 40%) attempted to steer buyers toward internal combustion engine (ICE) vehicles instead of the PEV in which they had expressed interest. Thirteen of those dealers tried to entirely discourage shoppers from buying an EV. Legacy profits from on-going maintenance of ICE vehicles, most of which are not required for an EV, is considered a major incentive for dealers to steer customers away from EVs. Increased demand from consumers will be the key driver in forcing manufacturers and dealers to change their perception of EVs from a necessary regulatory evil to a new product category.

Range anxiety is the fear that a vehicle has insufficient range to reach its destination and would thus strand the vehicle’s occupants. The term, primary used in reference to battery electric vehicles (BEVs), is considered to be one of the major barriers to large-scale adoption of EVs. The main strategies to alleviate range anxiety are the development of higher battery capacity (Tesla S now sports a model with a 265-mile range and other manufacturers are working to follow suit with over 200-mile range EVs), battery swapping technology, and the deployment of charging station infrastructure.

Despite the obstacles in creating a new market, the fleet of plug-in electric vehicles in the United States is the largest in the world with over 400,000 highway legal plug-in electric vehicles (EVs) sold in the country since 2008 when Tesla introduced its first car through 2015.EV-sales-growing

As of March of this year, there are 26 highway legal plug-in cars available in the American market from over a dozen manufacturers plus several models of electric motorcycles, utility vans and neighborhood electric vehicles (NEVs). The number of EV drivers has increased ten times in the past four years and EVs are expected to comprise over 8% of all car sales by 2020. New EV cars with increased range are being developed by many auto manufacturers – and some new entrants like Apple which has its first car, code name “Project Titan” planned for release in 2019.

However, consumers have been cautious about putting the car before the charging station. “Infrastructure for EVs is crucial to the adoption of use of electric cars. You’re not going to buy a car if you don’t know where and how to charge it,” says Erin Mellon, Director of Communications with ChargePoint, which operates the world’s largest EV charging network. The first place drivers need to be able to charge is at home. Being able to charge at work is second most important.”where-drivers-charging-chargepoint

Equally innovative but decidedly less exciting is what is happening with the growing infrastructure of EV charging stations, a stimulant for expansion of the market for plug-in electric vehicles. As of January 2016, the US had 12,200 charging stations across the country, led by California with nearly 3,000 stations. In terms of public charging points, there were 30,669 public outlets available across the country by the end of January 2016, again led by California with 9,086 charging points (29.6%).

The following excerpt from an article published last September by Jones Lang LaSalle (“JLL”), a premier international commercial real estate brokerage, property and investment management firm headquartered in Chicago, entitled “Charging into the future: The rise of electric cars,” reflects cutting edge planning and action – much like being an innovator at the turn of the 20th Century who invested in gasoline stations rather than livery stables:

Sean McNamara, General Manager for JLL Property Management, began looking at electric charging stations for an office building in San Francisco several years ago. “In the beginning of the discovery process, there was just not enough demand or infrastructure,” he says.

U.S. Secretary of Energy Steven Chu initiated the “Workplace Charging Challenge” in 2013 to increase the number of US employers offering EV charging stations – tenfold – by 2018.

“The proliferation of electric cars, has made these stations much more relevant over the past two years,” McNamara says.

Trophy and Class AA office buildings, such as the Georgia Pacific Center in Atlanta, were among the first to respond to Chu’s challenge. “Ownership and JLL are compelled largely because it’s the right thing to do for our environment. We are a LEED-certified building and our objective is to maintain the highest status possible,” explains Michael Strickland, a VP & Group Manager for JLL in Atlanta.

Strickland says that the Building’s 10 EV reserved parking spaces plus two public parking spaces equate to about one percent of the total parking spaces. “The Building has immediate access to public transport, which plays a role in how many building tenants drive and utilize the parking garage,” Strickland says. “It’s definitely a growing trend. But it’s not currently on par with having a sundry shop or a dry cleaner – yet….”

Today, McNamara is the General Manager of Southeast Financial Center, a Class A trophy office building in Miami. He oversees an 1,100-space parking structure with valet services and two EV charging stations. “In a Class A building, if the demand is there, the spaces will be added. Once the setup is done, sealing the delivery is even easier. Ultimately for landlords, it is not a matter of cost, it is a matter of appropriateness.”

Porsche Latin America, for example, a tenant in the Southeast Financial Center, installed two electric charging stations with special adapters, as a unique term of their lease. Then again, Porsche is not the average tenant. Earlier this month (September), the car manufacturer unveiled its first all-electric Mission E concept car at the Frankfurt Auto Show. It looks like a futuristic 911.

The Mission E, along with Audi’s e-Tron Quattro (scheduled to be launched in 2018), a hybrid SUV, would challenge Tesla’s Model S in the luxury category. Like Apple’s Project Titan, though, these models will take years to develop.

Until then, drivers can take their pick from available models such as the Nissan LEAF all-electric car, the Chevrolet Volt plug-in hybrid, the all-electric Tesla Model S and the Toyota Prius Plug-in hybrid, and a growing public infrastructure in which to park and charge them.

For buildings being designed and built, or undergoing a major renovation, to achieve LEED certification under the 2009 rating system, providing one of the following earns up to three points in the SS Credit 4.3, Alternative Transportation for Low-emitting & Fuel-efficient (LEFE) vehicles category:

  1. Preferred parking (closed spot or price discount of ≥ 20%) for LEFE vehicles for 5% of site’s Parking Capacity (parking discount must be made available to all who drive LEFE vehicles and must be available for a minimum of two (2) years) OR
  2. Alternative refueling stations for 3% of site’s parking capacity OR
  3. LEFE vehicle and preferred parking for 3% of FTE OR
  4. One (1) shared LEFE be provided for 3% of FTEs with a minimum of one per 267 FTE for at least two (2) years (minimum one LEFE required)

Further, projects may be awarded one point for EP for instituting a transportation management plan that demonstrates a quantifiable reduction in the auto use through implementation of multiple options.

Even at this stage in the development of the market for EVs, which represents the future of automobiles, an EV driver plugs into a ChargePoint station every five seconds, saving over 12.5 million gallons of gas and over 41 million kilograms of greenhouse gas emissions.

Today, Emerald Skyline is proud to announce that it has partnered with ChargePoint to provide for a greener tomorrow – for an emerald skyline!

“As a sustainability and resiliency consulting and LEED project management firm, this partnership allows us the latest technologies and largest and most open network available to provide our clients,” reports Abraham Wien, LEED AP O+M, Director of Architecture & Environmental Design for Emerald Skyline. “We are always looking for ways to provide superior products and services to meet our clients sustainability and resiliency needs.

With almost 28,000 charging stations, ChargePoint is the world’s largest network of electric vehicle (EV) charging stations in the US, Europe and Australia. ChargePoint stations set the industry standard for functionality and aesthetics and their innovative, cloud-based software gives station owners flexibility and control of charging operations. Stations on the ChargePoint network are independently owned businesses, which set their own pricing, access settings and much more.

demand-for-charging-stationsBeyond the workplace, EV charging stations are a distinctive and value-add amenity for hotels, restaurants, shopping centers and entertainment facilities – and a growing necessity for communities serving an ever-increasing demographic demanding an alternative to fossil-fuel driven vehicles.

An electric car will have to be able to travel long distances for EVs to break into the mass market. Like few other parts of the plug-in ecosystem, this has been demonstrated by Tesla Motors, which has built out its network of sites not only in the US, but in all their major markets. An 80% recharge that provides 200 miles or more in less than an hour enables Tesla owners to travel coast-to-coast with recharging breaks every three hours. And, despite the reticence of many in the industry about the prospect of being stationary for a half hour to hour break every three hours, Tesla drivers seem entirely satisfied with the network, to the point that congestion is an occasional problem while range anxiety is not.

The availability of a charging station will attract that additional guest or customer who will pay extra for the charge (yes, EV-charging stations can be an additional source of revenue by monetizing an EV-enabled parking spot). It will attract new customers to your business and encourage loyalty from a growing customer base of EV drivers.

Emerald Skyline Corporation will be providing ChargePoint EV Charging Station services and installations for corporate, municipality, and private entities. Together, we’re transforming the energy industry by developing intelligent energy management solutions to help people and businesses shift away from fossil fuels. impact-chargepoint-drivers

ChargePoint stations set the industry standard for functionality and aesthetics and their innovative, cloud-based software gives station owners flexibility and control of charging operations. Stations on the ChargePoint network are independently owned-businesses which set their own pricing, access settings and much more.

To find out more information about the installation of a ChargePoint Electric Vehicle Charging Station at your home, office building, shopping center, hotel or transportation hub and join the EV revolution for a greener tomorrow, please contact us at 305.424.8704 or go to www.emeraldskyline.com

Segregating the cost components of a “real” property allows for optimal cost recovery to increase after tax income

PJ Pictureby Paul L. Jones, CPA, Director, Emerald Skyline Corporation

In the fourth quarter of 1985, Philip Morris Inc. agreed to buy General Foods for an estimated $5.6 billion. At the time, it was the largest food company acquisition in history. Pursuant to this acquisition, Philip Morris had to allocate the purchase price among cash and cash equivalents, real estate, tangible personal property, identifiable intangible assets and, finally, goodwill.

In conjunction with this cost allocation, Kenneth Leventhal & Company, a CPA firm that specialized in real estate, was hired to value the property, plant and equipment and segregate them into real, personal and land improvement assets to establish basis for its tax returns. I was a leader on the team that completed the study and valuation. The project involved hundreds of properties on six continents, the expertise of an untold number of real estate, engineering and accounting professionals – and over a year – to complete.

The reason we segregated the personal property and land improvement assets was to shorten, to the extent possible, the time required, and maximize the deductions from taxable income, to recover the cost of the assets through depreciation resulting in reduced income tax obligations. Accordingly, the primary goal of a cost segregation study is to identify all construction-related costs that can be depreciated over a shorter tax life (typically 5, 7 and 15 years) than the building (39 years for non-residential real property). Personal property assets, consisting of non-structural elements, exterior land improvements and indirect construction costs which are found in a cost segregation study generally include items that are affixed to the building but do not relate to the overall operation and maintenance of the building.

The investment strategy for every rental residential apartment complex and commercial building, including office buildings, shopping centers, industrial facilities, hotels, restaurants, entertainment complexes and all other commercial properties that are being acquired, constructed and/or sustainably renovated to be “Green” should include accelerated depreciation realized from a cost segregation study.

cost-segregationBy increasing the depreciation deduction, current income taxes are reduced and after-tax cash flow increased during the initial years of ownership or completion of substantial sustainable renovations – when their net present value and positive impact on the investor’s internal rate of return is the greatest.

A cost segregation study, in a nutshell, is the process of identifying any personal property and land improvement assets that are grouped with real property assets, and accounting for them separately, in particular, for Federal income tax purposes. The determination of what property components qualify for shorter depreciable lives as personal property is ultimately based on asset-specific facts and circumstances. However, consultants rely heavily on precedents existing in both case law and IRS guidance.

The law, rules and procedures relied upon in cost segregation studies have been around since the enactment of the Investment Tax Credit (ITC) in 1962 which established the legal rationale used to distinguish personal from real property for purposes of the ITC and provides the framework for the same classification process in cost segregation studies.

While the ITC was repealed through the Tax Reform Act of 1986, a landmark tax court decision in the case of Hospital Corporation of America (“HCA”) vs. Commissioner, 109 TC 21 issued in 1997 upheld the application of cost segregation for differentiating the depreciable basis of real, personal and land improvement assets. The HCA case is the seminal case for cost segregation studies and the IRS has agreed that a taxpayer can use a cost segregation study to segregate building costs. Critical to the Tax Court’s analysis was that in formulating accelerated depreciation methods, Congress intended to distinguish between components that constitute IRC section 1250 class property (real property) and property items that constitute section 1245 class property (tangible personal property). This distinction opened the doors to cost segregation.

Armed with this victory, taxpayers have increasingly begun to use cost segregation to their advantage. The IRS reluctantly agreed that cost segregation does not constitute component depreciation (action on decision (AOD) 1999-008). Moreover, cost segregation recently was featured in temporary regulations issued by the Treasury Department (regulations section 1.446-1T). In a chief counsel advisory (CCA), however, the IRS warned taxpayers that an “accurate cost segregation study may not be based on non-contemporaneous records, reconstructed data or taxpayers’ estimates or assumptions that have no supporting records” (CCA 199921045).

Real property eligible for cost segregation includes buildings that have been purchased, constructed, expanded or remodeled since 1987. A cost segregation study is typically cost-effective for buildings purchased or remodeled at a cost greater than $750,000. These studies are most efficient for new buildings recently constructed, but they can also uncover retroactive tax deductions for older buildings, which can generate significant short benefits due to “catch-up” depreciation.

Property owners should consider using a cost segregation study if they:

  • Acquired property in the last 15 years
  • Recently completed or started a construction project
  • Inherited property from an estate and received a stepped-up basis
  • Purchased a partnership share
  • Expect to pay income taxes
  • Plan on holding the property for at least five years

Examples of assets that may qualify to be reclassified as Section 1245 property (tangible personal property) which have shorter depreciable lives include:

  • Land improvements (drainage and irrigation systems, fencing, outdoor lighting, landscaping, parking lots and walkways, etc.);
  • Ornamental fixtures;
  • Wall and floor coverings;
  • Security systems;
  • Cabinets and millwork;
  • Data and communication cabling;
  • Decorative lighting;
  • Window treatments;
  • Production machinery;
  • Electrical and plumbing service to specific equipment;
  • Energy management systems;
  • Equipment, machinery and equipment that meet the “sole justification test” (i.e., building system components the sole justification for the installation of which is the fact that such equipment….are essential for the operation of other machinery or the processing of materials or used in connection with research of experimentation); and
  • Moveable wall partitions, catwalks and mezzanines

According to IRS Publication 544: “The fact that the structure is specially designed to withstand the stress and other demands of the property and cannot be used economically for other purposes indicates it is closely related to the use of the property it houses. Structures such as oil and gas storage tanks, grain storage bins, silos, fractionating towers, blast furnaces, basic oxygen furnaces, coke ovens, brick kilns, and coal tipples are not treated as buildings, but as section 1245 property.”

In distinguishing between a building’s tangible personal property and structural components, Jay Soled and Charles Falk in a 8/1/2004 article entitled “Cost Segregation Applied” in the Journal of Accountancy, “CPAs, engineers and consultants will find the courts to be a final source of guidance. In Whiteco Industries, Inc. v. Commissioner (65 TC 664 (1975)), for example, the Tax Court set forth the following six questions that can use to determine whether property is inherently permanent and thus a structural component excluded from the definition of tangible personal property:

  • Can the property be moved? Has it been moved? (For example, a shed with a concrete floor vs. a shed with a wooden floor.)
  • How difficult is removal of the property, and how time-consuming is it? (For example, a wine cellar vs. a prefabricated photo-processing lab.)
  • Is the property designed or constructed to remain permanently in place? (For example, a wooden barn vs. a wire chicken coop.)
  • Are there circumstances that tend to show the expected or intended length of affixation—or that the property may or will have to be moved? (For example, permanent concrete pilings vs. floating docks that can be removed in the winter.)
  • How much damage will the property sustain upon its removal? (For example, a steel-encased bank vault vs. an easily removable lighting system attached by bolts.)
  • How is the property affixed to the land? (For example, permanently glued bathroom tile vs. removable billboard.)

Even with ample regulatory, legislative and judicial guidance, making the distinction between tangible personal property and a building’s structural components remains a challenge for CPAs. No bright-line test exists. What is fortunate, however, is that many of the factual issues involving properties of different sorts have been litigated, and their outcomes illuminate the direction a court confronted with similar facts is likely to take.”

The primary property recovery periods are:

  • Buildings = 27.5 years for residential and 39 years for commercial
  • Land Improvements = 15 years
  • Furniture, fixtures & equipment = 7 years
  • FF&E, Retail & service = 5 years
  • Information systems = 5 years

Cost segregation consultants generally employ one of two methods, or a combination of both, that have approved by the IRS:

The first approach is to obtain and examine actual cost data records and construction documents in conjunction with a site visit to identify assets for potential reclassification. This approach is typically used when the property has been recently constructed and documents are readily available. The consultant assigns costs to each component based on any information provided, analysis of the documents and site visit.

The second approach, applicable when the original construction documentation is not available, is typically performed when a study is performed in conjunction with the purchase of the property. This alternative is also performed when the cost segregation study is conducted several years after initial construction. In applying this approach, an engineer or consultant will analyze architectural drawings, mechanical and electrical plans and other blueprints to segregate the structural and general building electrical and mechanical components from those linked to personal property. Using standard construction cost estimating tools, the property is “reverse-engineered” into its separate components. The consultant will also allocate “soft costs,” such as architect and engineering fees, to all components of the building. Total actual property costs are then allocated to the components on a proportional basis.

The information and documents typically required for a cost segregation study include:

  • legal description of the property
  • Date placed in service
  • Building and land area
  • Survey
  • Architectural and building plans
  • AIA documents 702 & 703
  • Other construction documents and accounting records
  • Depreciation schedules
  • Fixed asset listing
  • Construction loan documents, if available
  • Settlement statement
  • Appraisal

The consultant provides a self-contained cost segregation report, certified by the study’s authors, that will satisfy IRS requirements.

The benefits can be significant. BKD LLP, CPAs calculates that “Each $100,000 in assets reclassified from a 39-year recovery period to a five-year recovery period results in approximately $16,000 in net-present-value savings, assuming a 5% discount rate and a 35% marginal tax rate.

By reclassifying an asset from building (1250) to personal property (1245) property, the magnitude of an additional allowance in the first year can be enormous. For example, a shift of $1 million from 39-year property to 5-year property can augment first-year depreciation deductions by a whopping $575,000 ($25,000 vs. $600,000). Note: The application of the alternative minimum tax may reduce some of the tax savings associated with cost segregation.

Cost segregation studies should be performed by consulting firms with expertise in engineering, construction, tax and accounting. The IRS’ underlying assumption in determining what constitutes a quality study is that the study is performed by “personnel competent in the design, construction, auditing, and estimating procedures relating to building construction.”

Emerald Skyline Corporation, whose principals include real estate, sustainability, resiliency, architecture and accounting professionals is uniquely qualified to provide cost segregation advisory services to building owners, investors, managers and accountants in conjunction with your sustainability and resiliency project. Each cost-segregation study prepared by Emerald Skyline includes an identification of any available Green Building Tax incentives. Often overlooked, these valuable tax credits can amount up to 30% of qualified expenditures and increase the tax benefits of a cost segregation study.

Water Conservation Tips from National Geographic

In honor of Earth Day, we wanted to share some water conservation tips that make it easy for everyone to do their part.

Toilets, Taps, Showers, Laundry, and Dishes

  • 1994 was the year that federally mandated low-flow showerheads, faucets, and toilets started to appear on the scene in significant numbers.
  • On average, 10 gallons per day of your water footprint (or 14% of your indoor use) is lost to leaks. Short of installing new water-efficient fixtures, one of the easiest, most effective ways to cut your footprint is by repairing leaky faucets and toilets.
  • If you use a low-flow showerhead, you can save 15 gallons of water during a 10-minute shower.
  • Every time you shave minutes off your use of hot water, you also save energy and keep dollars in your pocket.
  • It takes about 70 gallons of water to fill a bathtub, so showers are generally the more water-efficient way to bathe.
  • All of those flushes can add up to nearly 20 gallons a day down the toilet. If you still have a standard toilet, which uses close to 3.5 gallons a flush, you can save by retrofitting or filling your tank with something that will displace some of that water, such as a brick.
  • Most front-loading machines are energy- and water-efficient, using just over 20 gallons a load, while most top-loading machines, unless they are energy-efficient, use 40 gallons per load.
  • Nearly 22% of indoor home water use comes from doing laundry. Save water by making sure to adjust the settings on your machine to the proper load size.
  • Dishwashing is a relatively small part of your water footprint—less than 2% of indoor use—but there are always ways to conserve. Using a machine is actually more water efficient than hand washing, especially if you run full loads.
  • Energy Star dishwashers use about 4 gallons of water per load, and even standard machines use only about 6 gallons. Hand washing generally uses about 20 gallons of water each time.

Yards and Pools

  • Nearly 60% of a person’s household water footprint can go toward lawn and garden maintenance.
  • Climate counts—where you live plays a role in how much water you use, especially when it comes to tending to a yard.
  • The average pool takes 22,000 gallons of water to fill, and if you don’t cover it, hundreds of gallons of water per month can be lost due to evaporation.

Diet

  • The water it takes to produce the average American diet alone—approximately 1,000 gallons per person per day—is more than the global average water footprint of 900 gallons per person per day for diet, household use, transportation, energy, and the consumption of material goods.
  • That quarter pounder is worth more than 30 average American showers. One of the easiest ways to slim your water footprint is to eat less meat and dairy. Another way is to choose grass-fed, rather than grain-fed, since it can take a lot of water to grow corn and other feed crops.
  • A serving of poultry costs about 90 gallons of water to produce. There are also water costs embedded in the transportation of food (gasoline costs water to make). So, consider how far your food has to travel, and buy local to cut your water footprint.
  • Pork costs water to produce, and traditional pork production—to make your sausage, bacon, and chops—has also been the cause of some water pollution, as pig waste runs into local water sources.
  • On average, a vegan, a person who doesn’t eat meat or dairy, indirectly consumes nearly 600 gallons of water per day lessthan a person who eats the average American diet.
  • A cup of coffee takes 55 gallons of water to make, with most of that H2O used to grow the coffee beans.

Electricity, Fuel Economy, and Airline Travel

  • The water footprint of your per-day electricity use is based on state averages. If you use alternative energies such as wind and solar, your footprint could be less. (The use of biofuels, however, if they are heavily irrigated, could be another story.) You would also get points, or a footprint reduction, for using energy-star appliances and taking other energy-efficiency measures.
  • Washing a car uses about 150 gallons of water, so by washing less frequently you can cut back your water use.
  • A gallon of gasoline takes nearly 13 gallons of water to produce. Combine your errands, car pool to work, or take public transportation to reduce both your energy and water use.
  • Flying from Los Angeles to San Francisco, about 700 miles round-trip, could cost you more than 9,000 gallons of water, or enough for almost 2,000 average dishwasher loads.
  • A cross-country airplane trip (about 6,000 miles) could be worth more than 1,700 standard toilet flushes.
  • Traveling from Chicago to Istanbul is just about 10,000 miles round trip, costing enough water to run electricity in the average American home for one person for more than five years.

Industry—Apparel, Home Furnishings, Electronics, and Paper

  • According to recent reports, nearly 5% of all U.S. water withdrawals are used to fuel industry and the production of many of the material goods we stock up on weekly, monthly, and yearly.
  • It takes about 100 gallons of water to grow and process a single pound of cotton, and the average American goes through about 35 pounds of new cotton material each year. Do you really need that additional T-shirt?
  • One of the best ways to conserve water is to buy recycled goods, and to recycle your stuff when you’re done with it. Or, stick to buying only what you really need.
  • The water required to create your laptop could wash nearly 70 loads of laundry in a standard machine.
  • Recycling a pound of paper, less than the weight of your average newspaper, saves about 3.5 gallons of water. Buying recycled paper products saves water too, as it takes about six gallons of water to produce a dollar worth of paper.


National Geographic
View original article here

U.S. Green Building Council’s New Report Reveals Hospitality Industry Poised for Tremendous Growth in Green Building

U.S. Green Building Council’s New Report Reveals Hospitality Industry Poised for Tremendous Growth in Green Building

LEED in Motion: Hospitality report highlights hotel brands across the world incorporating LEED and other sustainability practices

Washington, D.C. — (Feb. 18, 2016) — Today, the U.S. Green Building Council (USGBC) released its LEED in Motion: Hospitality report, which showcases tremendous industry growth in green building and defines the scale up opportunities for the hospitality sector. More than 109 million square feet of hotel space is currently LEED certified, and the report highlights some of the most impressive LEED-certified hotels throughout the world.

“Across industries we are seeing an increase in consumer demand toward sustainability practices, and no industry is better poised to meet these demands than hospitality. This growing sector is rapidly adopting green buildings because owners and developers want to enhance their triple bottom line – people, planet and profit,” said Rick Fedrizzi, CEO and founding chair, USGBC. “LEED is a transformative tool that positively impacts the quality of our built space by creating a healthier, more sustainable environment that saves money and resources.”

Hotels consume natural resources at an extraordinarily high rate as they are occupied 24 hours a day, seven days a week. With more than five billion square feet of space in the U.S. alone, there is an enormous opportunity for the industry to transform the impact of the built environment. A

LEED (Leadership in Energy & Environmental Design), the world’s most widely used green building rating program, has a growing presence in the hospitality industry – and the number of LEED-certified buildings is expected to continue at a strong pace. Currently, there are more than 1,400 hotels participating in LEED representing 638.7 million square feet. Of that, there are more than 300 LEED-certified hotels comprising nearly 109.2 million square feet of space.

According to a recent study by McGraw Hill Construction, green construction in the hospitality sector has increased by 50 percent from 2011-2013 and now represents 25 percent of all new construction in the sector today. USGBC’s recent Green Building Economic Impact Study also found that across industries, green construction is outpacing that of traditional construction and is poised to create more than 3.3 million U.S. jobs and $190.3 billion in labor earnings by 2018.

LED Lighting: Both Art and Science

JulieBy Julie Lundin, Founder,
Director of LEED Process Management for Emerald Skyline Corporation

As a registered commercial interior designer and as a LEED AP (Leadership in Energy and Environmental Design Accredited Professional), I balance the aesthetics of lighting, the “art” and the technical knowledge the “science” when finding solutions for our clients project needs. Lighting is for people, so there must be an understanding of the visual quality users need for health, safety, productivity and enjoyment. Combining the needs of people, with the aesthetics desired and the rapidly changing technical knowledge are key when specifying lighting for any project. In addition, today’s buildings also require the need to consider the economics, sustainability and impact on the environment when making our decisions.

“More and more, so it seems to me, light is the beautifier of the building.”
Frank Lloyd Wright – Architect

Whether you are an individual homeowner or a business involved in commercial spaces you have probably noticed the rapidly evolving lighting product market. The standard incandescent bulbs that Edison invented and we all used for years are no longer available. They are being phased out by the federal government. Next, CFL’s (compact fluorescent lights) became the go to option for customers seeking an inexpensive, energy efficient replacement for the standard incandescent bulb. However, CFL’s have had issues with the quality of light which was perceived as harsh by users, they were slow to warm up and difficult to dim, and contain mercury. CFL’s are now also being phased out. General Electric announced earlier this year that they will stop making and selling these bulbs in the U.S. by the end of 2016. “Now is the right time to transition from CFL to LED,” said John Strainic, chief operating officer of consumer and conventional lighting at GE Lighting. Per Mr. Stranic, retailers are also moving away from CFL’s which will have a harder time qualifying for the Energy Star rating under regulations proposed for next year.

Initially LED’s were expensive but gained customer support because they offer better light quality. As with many emerging technical and consumer products, prices for LED bulbs have dropped steadily as manufacturing has increased and the products have been embraced in the mainstream. Manufacturers and retailers have also used coupons and rebates to further bring down the cost. Even as the prices are dropping the technology of LED’s has improved over the years.

There is no denying the energy efficiency of LED’s but other performance factors should be taken into consideration when deciding which product will work best for the intended use.

LED Glossary and Performance Factors

Efficacy – the rating for lumen output per watt, an easy measurable metric that compares the energy consumption and output of different light sources. Per Eric Lind of Lutron Electronics, the efficacy rating is starting to lose its relevance in favor of overall performance measurements. “If I’m trying to evaluate how much it costs to operate a building, lumens per watt is a good measurement,” says Lind. “The challenge is that buildings are there for a purpose and the color and quality of light have an impact on the people inside”.

Color Rendering Index – CRI is a measurement of a light sources accuracy in rendering different colors when compared to a reference light source with the same correlated color temperature. The closer a light source is to a score of 100, the better its color rendering. The higher the CRI, the better the visual perception of colors. Energy Star requires eligible fixtures to use lamps with a CRI above 80.

Lumens – Lumens are the perceived brightness of a lamp (bulb) and one part of a light sources distinct character.

Color Temperature – The other part of a light sources character, color temperature is a description of the warmth or coolness of a light source. Color temperature is measured on the Kelvin scale and is not the ambient hot/cold temperature of our surroundings. Confusingly the Kelvin scale goes backwards, the higher the color temperature, the cooler the light gets and the lower the color temperature, the warmer the light gets.

An example of color temperature application in a commercial building interior, a warmer (i.e. lower color temperature) light is often used in public areas to promote relaxation, while a cooler (higher color temperature) light is used to enhance concentration in offices. Lighting is one of the most important items that should be addressed in every space. An improperly lighted space can cause accidents, eyestrain, impact the occupant mood, and even how people look.

Color temperature and lumens are the new specifications that people need to know when choosing LED lamps.

Watts – Watts are what we used to measure brightness in the use of incandescent and CFL’s. With LED’s, lumens are the indicator of indicator of brightness.

Controllability – the option of changing light levels and color temperature to suit individual needs and important to user satisfaction.

color temperature kelvin scale

LED Lighting Retrofits – The Low Hanging Fruit

In commercial facilities, lighting efficiency improvement is the simplest energy saving strategy, “the low hanging fruit”. Lights consume from 15 to 40 percent of the annual energy use for most buildings and are usually less expensive to change than other systems. Often there is more than energy savings in most lighting improvement projects:

  • Lower Cooling Costs – Lights generate waste heat, improved lighting efficiency can lower your air conditioning costs.
  • Demand Savings – Reducing the amount of electricity used for lighting may reduce peak demand billing costs.
  • Increased Occupant Productivity – Better lighting may permit faster work patterns with fewer errors and increased productivity.
  • Reduced Absenteeism – Improper lighting can cause glare which results in fatigue, headaches and absenteeism.
  • Increase Safety and Security – Proper light levels reduce the possibility of as well as improve the safety of the employees and vehicle traffic. LED retrofits of parking garages and parking lots are important for employee safety and security.
  • Lower Maintenance Costs – LED light sources have a longer lamp life than incandescent and CFL’s resulting in lower lamp replacements and labor costs.

Lighting is one of the most important items that should be addressed in any building. It has the capability to impact the occupants, the cost of operations and the environment. The Emerald Skyline team can assist you with your LED lighting retrofit project resulting in energy savings, lower cooling costs and most importantly occupant health, safety and productivity. Lighting has the ability to positively transform any space, a true blend of art and science.


G.E. to Phase out CFL Bulbs

http://www.nytimes.com/2016/02/02/business/energy-environment/ge-to-phase-out-cfl-light-bulbs.html?_r=0

Long Lasting LED Bulbs Now 90% Cheaper

http://time.com/money/3831356/cheap-led-lightbulb-philips/

Industrial Assessment Center – Energy Web Tool

http://iac.missouri.edu/webtool/TaskDocuments/lighting/lighting.html

The Price of Water is Rising: Time to start conserving to improve the bottom-line

PJ Pictureby Paul L. Jones, CPA, LEED Green Associate
Emerald Skyline CorporationPRICE of H2O

America’s water treatment and supply networks were built in the decade following World War II – 60 to 70 years ago. The results of those investments fueled a generation of widespread economic growth, prosperity and improvement in public health. However, the thousands of miles of distribution pipes beneath city streets, the lengthy water transport and treatment infrastructure are now cracked and brittle. The bill to repair and renew America’s long-neglected water systems are now coming due – and it will not be cheap.

Distribution pipes, which run for thousands of miles beneath a single city, have aged beyond their useful life and crack open daily. Some assessments estimate the national cost of repairing and replacing old pipes at more than US 1 Trillion over the next 20 years. In addition, new treatment technologies are need to meet the Safe Drinking Water Act and Clean Water Act requirements, and municipal water companies must continue to pay on their debts.

Add to the needed infrastructure costs, the impact of droughts and sea level rise which are affecting the three most populous states in the country (California, Texas and Florida) and water managers are seeking ways to reduce consumption – with price increases as one way to encourage conservation. The EPA has identified at least 36 states that have experienced, or can anticipate, some type of local, regional or statewide water shortage which will have a significant impact on both consumers and commercial facilities.

According to an annual pricing survey by Circle of Blue, the price of water rose six percent in 30 major US cities last year and it has risen 41% since 2010. Brett Walton, Circle of Blue, 4/22/2015

“In Chicago and neighboring communities that depend on the City for their water supply, a 25% rate increase took effect on 1/1/2012. The rate went up again in 2013 by 15%, and will increase again by 15% in 2014. That’s a 55% increase over a 3-year period. Even though American municipalities have traditionally underpriced water, a 55% increase in such a short amount of time is an indication that a serious problem exists – with no resolution in sight.” Klaus Reichardt, Environmental Leader, 10/14/2013

Further, more than 40 US cities are required to make massive investments in wastewater treatment capacity which are driving sewer rate increases as Federal grants that funded the current generation of sewage treatment facilities are no longer available so municipal utility companies must finance these projects on their own. In other words, they will be increasing sewer fees in order to keep our water clean.

“We expect water rates to continue to grow above inflation for some time. We don’t see an end in sight.” Andrew Ward, director of US Public Finance, Fitch Ratings.

It is clear that the cost of water and wastewater services are going to continue to increase at rates well above the consumer price index.

Commercial and institutional buildings use a large portion of municipally-supplied water in the United States. In fact, the EPA estimates that facilities such as schools, hotels, retail stores, office buildings and hospitals account for up to 17% of publicly-supplied and 18% of energy use. The three largest uses of water in office buildings are restrooms, heating and cooling, and landscaping.

END -- -- USESAccordingly, implementing water-efficiency measures, while resulting in immediate savings will also serve to reduce the financial impact of future rate increases – a hedge against inflation, if you will. According to the EPA, which has established Water Sense at Work: Best Management Practices for Commercial and Institutional Facilities, “the benefits of implementing water-efficiency measures, in and around office buildings can include reducing operating expenses as well as meeting sustainability goals. In addition to water savings, facilities will see a decrease in energy costs because of the significant amount of energy associated with heating water.

NOTE: Water efficiency refers to long-term reduction in water consumption that is not in response to any current water shortages. Water-efficient systems enable a facility to meet users’ needs while using less water than conventional equivalents.

Water consumption in commercial and institutional buildings is dependent on many factors: The age of the building, the local climate, the use of the facility, the existence of a kitchen facility or restaurant amenity and the type and age of the HVAC system. However, in virtually all venues, the restrooms are the primary consumer of water. Accordingly, the best place for building owners and managers to start is the restroom.

Before introducing some water conservation strategies, the greatest impediment to achieving meaningful water savings in office buildings is the common disconnect between the accountant who pays the bills, the building owner, the tenants, the building manager or engineer and the various third-party contractors that maintain the facility and equipment. In multi-use or multi-tenanted properties, water saving potential is frequently great, but successful implementation of changes always requires a cooperative effort from all of the stakeholders.

Like an energy audit that identifies the main users of energy and benchmarks use, the best way to identify water conservation measures is to establish a water savings plan that benchmarks the ways water is consumed and prioritize them. Water conservation will vary in a commercial setting depending on the building type and use. While hospitals and office buildings require a large water volume for mechanical systems, hotels and restaurants require high usage in laundry and food service applications, respectively.

Determining the applications that have the greatest water consumption is critical to prioritize the overall goals and budget. One way to do this is by installing sub-meters in various facility locations (such as restrooms, cafeteria and food service areas, different floors or blocks of floors, etc.) and then monitoring water consumption in each area. This can provide insight into where water is being used and can also point out inconsistencies in water consumption—information that can sometimes result in significant savings.

For instance, a facility might find that one block of floors uses far less water than another block. Is this because there are fewer people on those floors? Or are there plumbing leaks or older fixtures in the block using more water? Tracking water use allows building engineers to move quickly to identify problem areas within a building’s water systems.

Once the systems and their water usage have been determined, a water savings plan can be developed. A water savings plan will inventory the systems in-place, identify water-efficient alternatives and estimates of the costs and benefits of each component of the plan. The benefits of water efficiency efforts can be measured by calculating the difference between what the building owners/managers previously spent on water and related operating costs and what they spend after water efficiency programs are implemented. The return on investment of new equipment, fixtures, and other water-related items can also be calculated over the lifetime of a water efficiency project, and includes such things as reduced maintenance, water, sewer, and related energy costs.

Typical Water Efficiency Plan Components

Below is a quick summary of how a typical commercial facility can use water more efficiently:

Toilets. Replace older toilets with fixtures that meet or exceed Uniform Plumbing Code (UPC) and International Plumbing Code (IPC) requirements: 1.6 gallons of water per flush. Some newer toilets, including high-efficiency and dual-flush models, use even less water than that. Facility System Solutions, in a 7/14/2014 article entitled “Mandated high-efficiency toilets pay off” reports that since being required by the Energy Policy Act of 1992 “low flow toilets have saved enough water to fulfill the needs of Los Angeles, Chicago and New York for two decades.” Further water reductions are achieved through dual-flush or high-efficiency EPA WaterSense-labeled toilets.

Faucets. Replace existing faucets or install restrictive aerators to reduce water use from approximately 2.2 gallons per minute to 0.5 gallons per minute.

Urinals. Again, replace older fixtures with newer models that use less water (one gallon of water per flush or less). However, facilities can achieve far greater savings by installing waterless urinal systems (unfortunately, many building codes do not allow these fixtures).  Further, according to a study by the Rand Corporation, waterless urinals often provide a significant savings due to their lower annual maintenance costs, in addition to the benefits incurred from reduced water use.

Alternative water sources. Some facilities, and even some legal jurisdictions, have installed or are planning to install “greywater” distribution systems. Grey water is tap water soiled by use in washing machines, tubs, showers, and bathroom sinks that is not sanitary, but it’s also not toxic and generally disease-free. Grey water reclamation is the process that capitalizes on the water’s potential to be reused instead of simply piping it into a sewage system. While this water is considered non-potable (that is, not for human consumption), it can usually be used for toilets and traditional urinals, as well as for plant/landscape irrigation in some cases.

Another “alternative” water source is rainwater which can be harvested where capturing and storing rainwater is an easy and effective way to conserve water through a commercially viable payback period. Selecting a rainwater harvesting system is dependent on the collection area of the commercial site and the intensity of rainfall in the particular region of the country. Once the availability and demand are calculated, the system should be designed to meet the daily demand throughout the dry season.

Cooling tower water recovery is another “alternative” source of water. Cooling towers remove heat from a building’s air conditioning system by evaporating some of the condenser water. Since all cooling towers continually lose water through evaporation, drift, and blowdown, they can consume a significant percentage of a building’s total water usage. Towers that are in good condition, operated properly, and well maintained allow chillers to operate at peak efficiency. Some cooling towers can use recycled water like stormwater or grey water if the concentration ratio is maintained conservatively low. Similarly, blowdown water may be reused elsewhere on-site.

Leak Detection. In most cases, leaky restroom fixtures and pipes are only fixed when they become excessive or cause problems, such as water pooling on floors. Leak detection systems in critical or remote locations tied to a BAS to notify maintenance staff of water leaks ensure a quick response before building walls, ceilings, and equipment are permanently damaged. A formal leak detection program—in which building engineers regularly check all fixtures and major plumbing connections on a set schedule — can save literally thousands of gallons of water annually.

And, finally, educate the users. Water conservation is not only about innovation and good design practices, but also about building an understanding among water consumers to work together to achieve a greener and more energy-efficient environment. It is important to educate users about water scarcity issues and the impact of water conservation practices through signage and awareness campaigns at the point of use.

Conclusion

Usually overshadowed by high-efficiency HVAC systems or LED lighting retrofits in commercial building modernization and sustainability programs, water is increasingly becoming a scarce commodity and implementing a water conservation plan may just be the low hanging fruit of sustainable benefits. From the invention of a water-leak detection system to implementing sustainable retrofits, the Emerald Skyline team can provide you with the tools and guidance you need to save money by saving water.